


Introduction
Imagine a cybersecurity analyst forced to work without a proper tool that collects data from scattered sources, analyzes and enriches information, and synthesizes the results. Faced with siloed data — like IP addresses, domains, and malware indicators — such analysts would be left to painstakingly piece together information, potentially missing critical relationships that could reveal the larger picture of an attack. Without such a tool, analysts would be in the dark, unable to spot the interconnected infrastructure that threat actors rely on, and they would struggle to identify perpetrators and bring them to justice. Sounds like a nightmare? It does, and yet many organizations must still connect the dots manually, spending too much time and effort dealing with data noise.
When we encountered such challenges at Group-IB, we realized that no solution on the market could meet all our investigative needs. This led us to create our own Graph, which was launched in 2017. Our Graph was way ahead of its time, consolidating data and helping analysts make faster and more accurate connections. The cybercriminal landscape has greatly evolved since then, however, with more and more sophisticated threats emerging all the time. In response, new security solutions are entering the market one after another. These shifts have created new challenges for cyber analysts: incidents have become more complex and difficult to respond to, massive data volumes are harder to correlate, and analysts face intense time pressure when investigating intricate cases. At the same time, the tools available to handle the avalanche of data haven’t kept pace with the changes.
To address these challenges, we combined expertise from our Investigation, Digital Forensics and Incident Response, Threat Intelligence, Digital Risk Protection, R&D, and UI/UX teams with customer feedback and once again pushed the limits by completely revamping Group-IB Graph. In this blog post, we explore the latest improvements in Graph and how it helps cybersecurity specialists in their daily battles against cybercrime.
Past and present challenges faced by cybersecurity experts
Whenever we investigated high-profile cases across the globe, we understood the key pain points for cybersecurity experts. This understanding helped us to develop and continuously improve our Graph. Let’s consider some of the main pain points:
- Overload of irrelevant information: Cybersecurity specialists are often overwhelmed by irrelevant data points that do not help to resolve the case.
- Automation of routine processes: Many investigative actions are routine yet essential — such as verifying emails, checking for breaches, and finding associated digital profiles. When done manually, these time-consuming tasks can distract analysts from more important work.
- Integration of diverse data sources: Analysts face significant challenges in consolidating data from various sources into a cohesive view. Without an integrated solution, specialists often rely on manual data transfers, which not only increases the workload and response time but also makes errors more likely.
- Tracing complex threats: Modern threat actors usually operate as branched syndicates that use advanced obfuscation techniques to stay under the radar. Attributing these threats requires significant time and effort, and is nigh impossible without a highly sophisticated investigative solution.
To address these pain points, Group-IB has created its own Graph.
What is Group-IB’s Graph?
Graph is an advanced investigation platform designed to link data from vast datasets, uncovering hidden connections, exploring historical information on various assets, and visualizing results in a clear graph structure. It can be used in a range of case scenarios and it helps analysts make faster, more informed decisions about the next steps in an investigation.
Graph analyzes three key groups of data: open network infrastructure data, cyber threat intelligence data, and social media data. All the interconnected data is stored within a ready-to-use graph that uses Artificial Intelligence to automatically filter out irrelevant information, making it clear and easy for cybersecurity professionals to focus on meaningful connections.
From challenges to reinvention: Why our Graph was completely redesigned
With decades of experience in investigating, preventing and responding to cybercrimes, Group-IB specialists understand the essential qualities of a robust investigative tool. While the original version of our Graph served us well, as cyberthreats became more sophisticated, we set out to reimagine Graph as a next-generation solution capable of adapting to today’s most complex challenges.
One of our biggest hurdles was the sheer growth of open-source data, which holds tremendous value for investigations. Integrating massive amounts of data in diverse formats while maintaining graph-building speed required a flexible, high-performing infrastructure. This need became even more pressing as our investigation cases became more complex, creating the need for new capabilities for even more sophisticated analyses.
Rather than simply upgrading the existing tool, we took a bold step: we completely redesigned Graph from the ground up. The overhaul included rewriting most of the code, equipping the solution with a sleek, modern interface, and adding new features that would allow Graph to meet both current and future investigative needs. The result is a solution that offers deeper analysis, enhanced speed, and a user experience in line with the demands of today’s cyber landscape.
Key innovative changes that will transform your investigative experience
The enhanced platform has achieved three things: better performance on account of its new engine, a fully redesigned user interface, and enriched data sources. The changes that have been made to Graph are described below.
One-click tool: Fully automated investigation journey
The challenge solved: Time-consuming manual efforts to process and analyze multi-source data
Our Graph offers users a simple and effective solution — the ability to obtain results with just one click. At the heart of this feature lies deep automation, which frees analysts from routine tasks, allowing them to focus their efforts on more complex challenges.
In investigations, we work with various types of data that need to be processed and analyzed to extract meaningful insights. Our Graph automates much of this process, transforming raw data into valuable information and knowledge. It streamlines the investigative workflow and speeds up decision-making.
We have consolidated all routine tasks into one powerful tool that transforms massive volumes of data from our data lake into a structured and organized database to support advanced investigations. Instead of manually expanding all data sets, users now only need a single click to initiate the analysis process, and the platform handles any complex work in the background. This not only speeds up the workflow but also significantly improves accuracy and ease.

Figure 1. One-button solution
| By introducing a new architecture and completely rewriting the backend, we have increased Graph’s automation and processing speed by an average of 60%. The enhancement is especially noticeable when working with larger graphs, where the number of nodes exceeds 4,000 — the graph-building speed has surged by an impressive 90%. The boost makes the platform significantly more scalable and responsive and therefore even more efficient when handling complex investigations. |
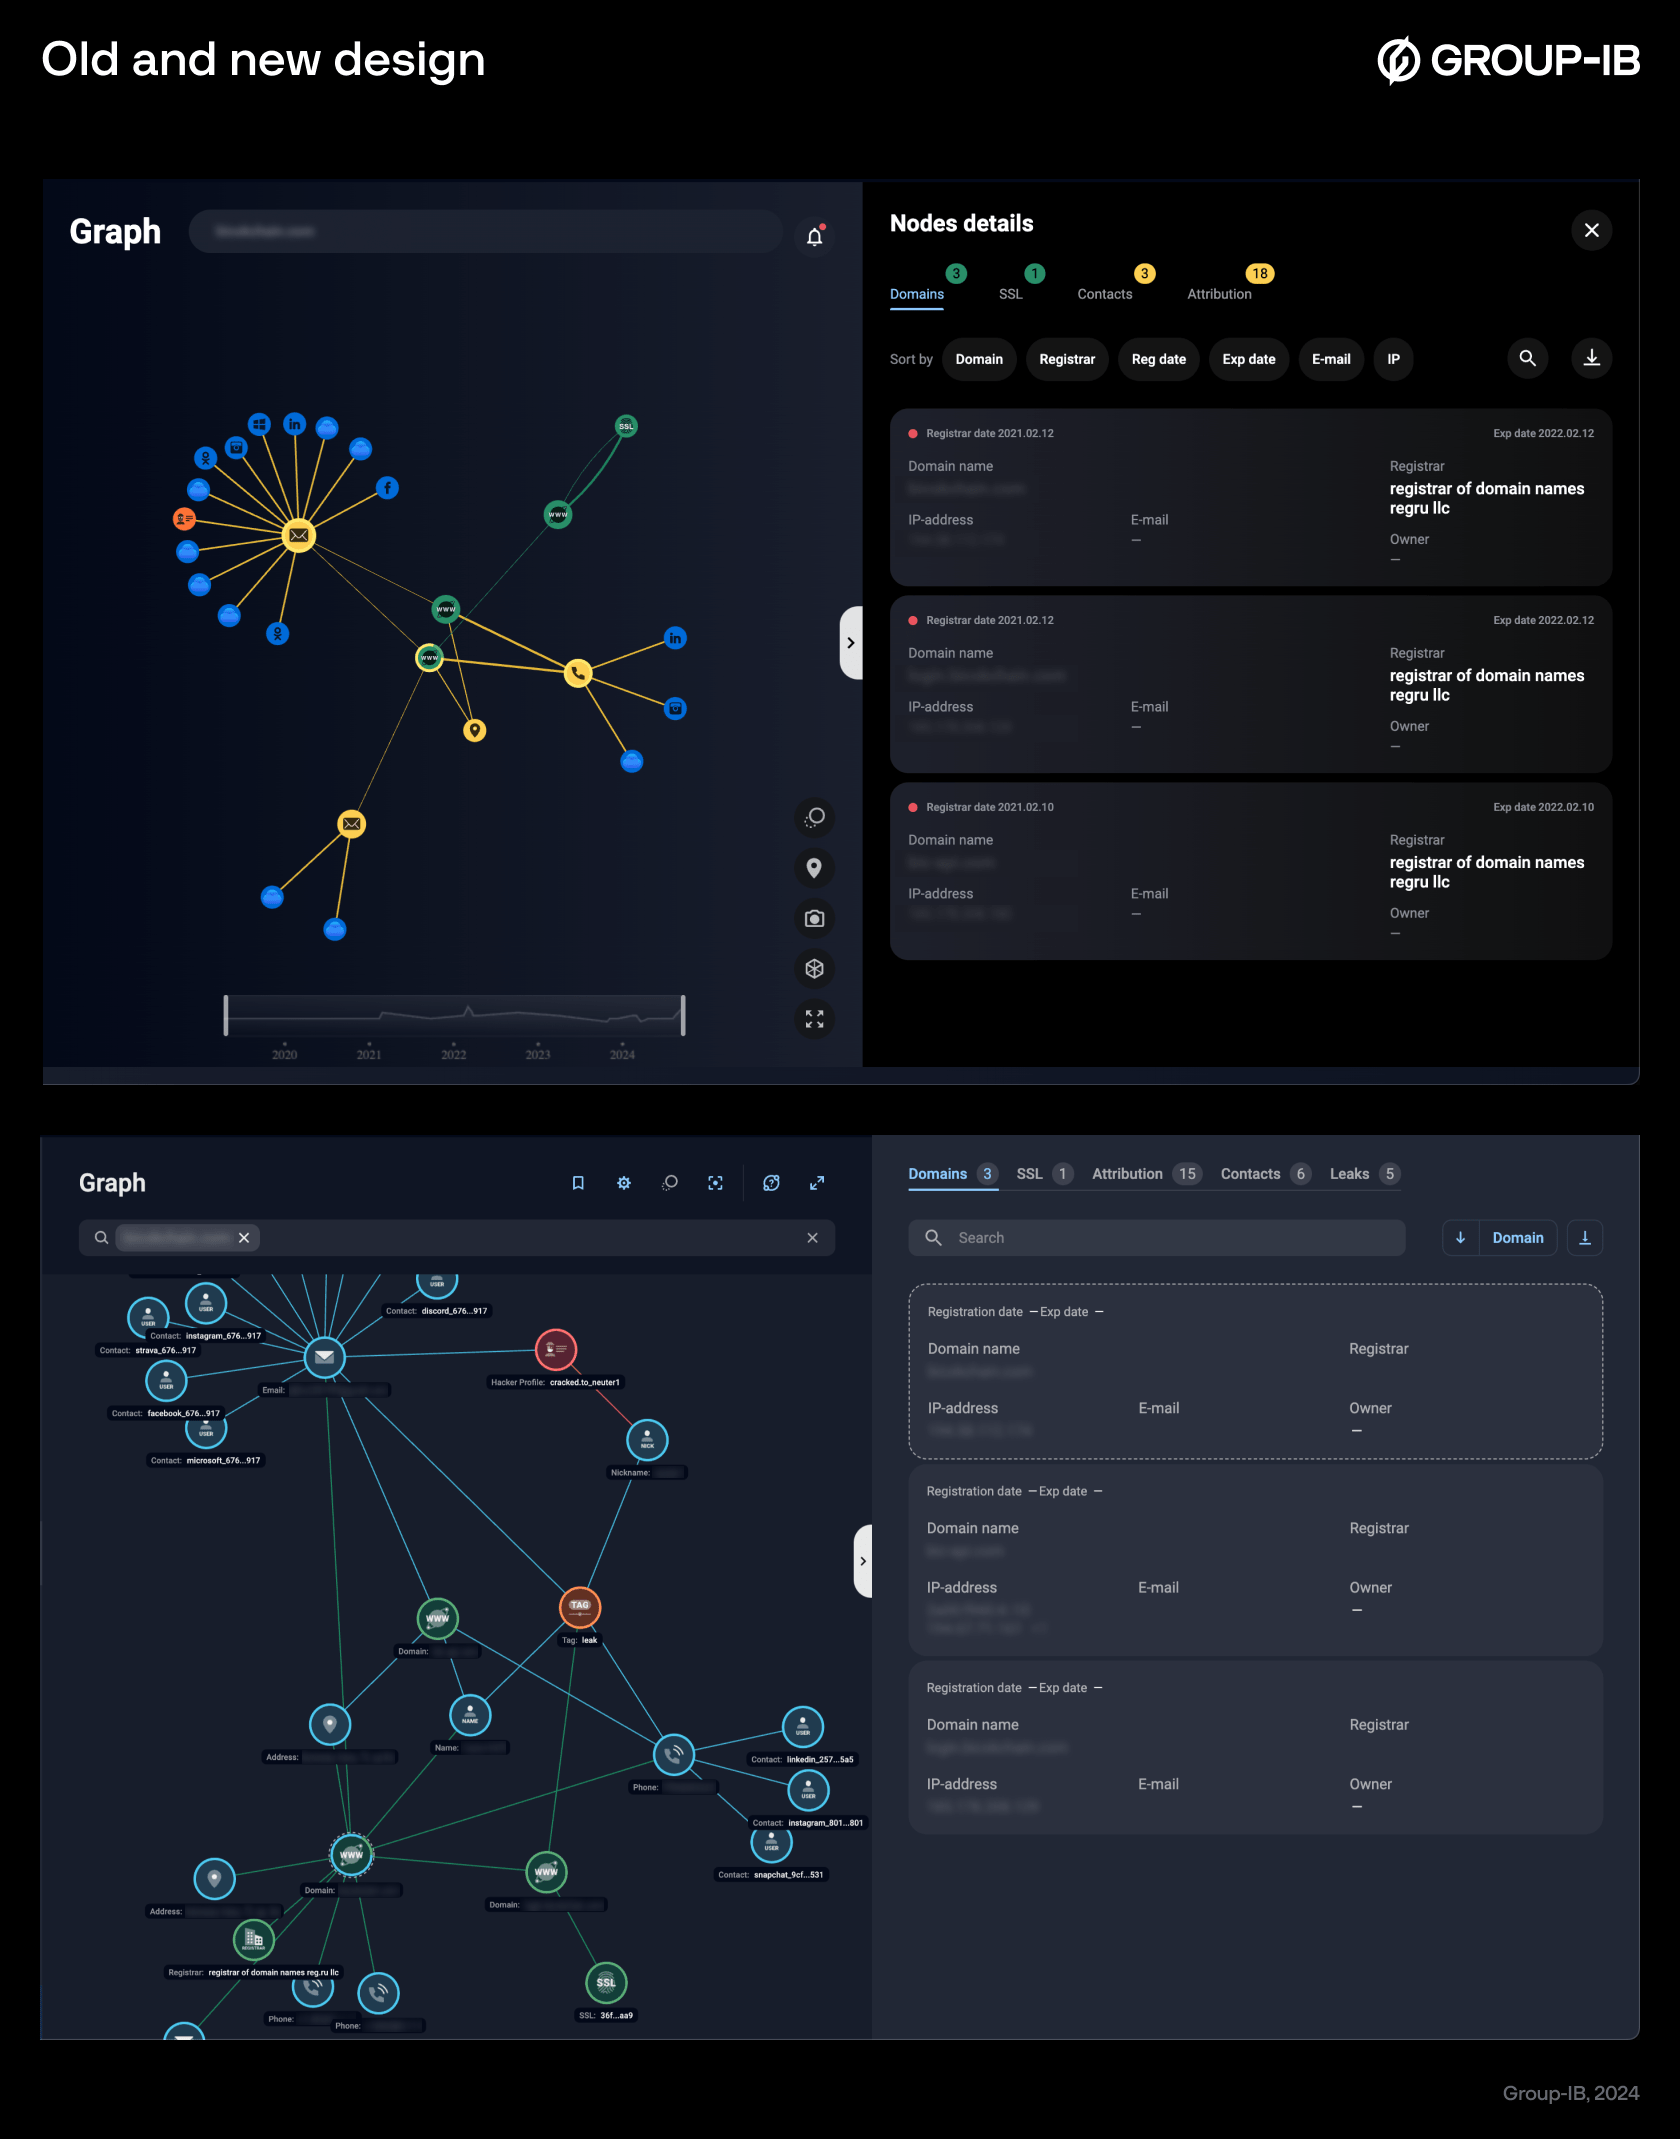
Figures 2-3. Old and new design
Redesigned interface: Beauty and the beast
The challenge solved: More expectations from the interface as investigations grow more complex
Our new interface for Graph isn’t just faster — it’s smoother and easier to work with, too. Imagine working on a complex investigation and having all your saved graphs right at your fingertips, ready to share with your team across the globe in seconds. Now, when you hover over nodes and connections, interactive tooltips pop up, providing instant context and timestamps that make it easy to connect the dots without missing anything.
Trying to find links between assets? The new interface lets you build the shortest path between two nodes instantly, making those key connections stand out. To keep everything organized, we have added clear, standardized table views in the sidebar so that spotting patterns and analyzing data is quick and straightforward. The new panel with detailed notes for each node type — like Domain, Registrar, or SSH — tells you exactly what you’re looking at.
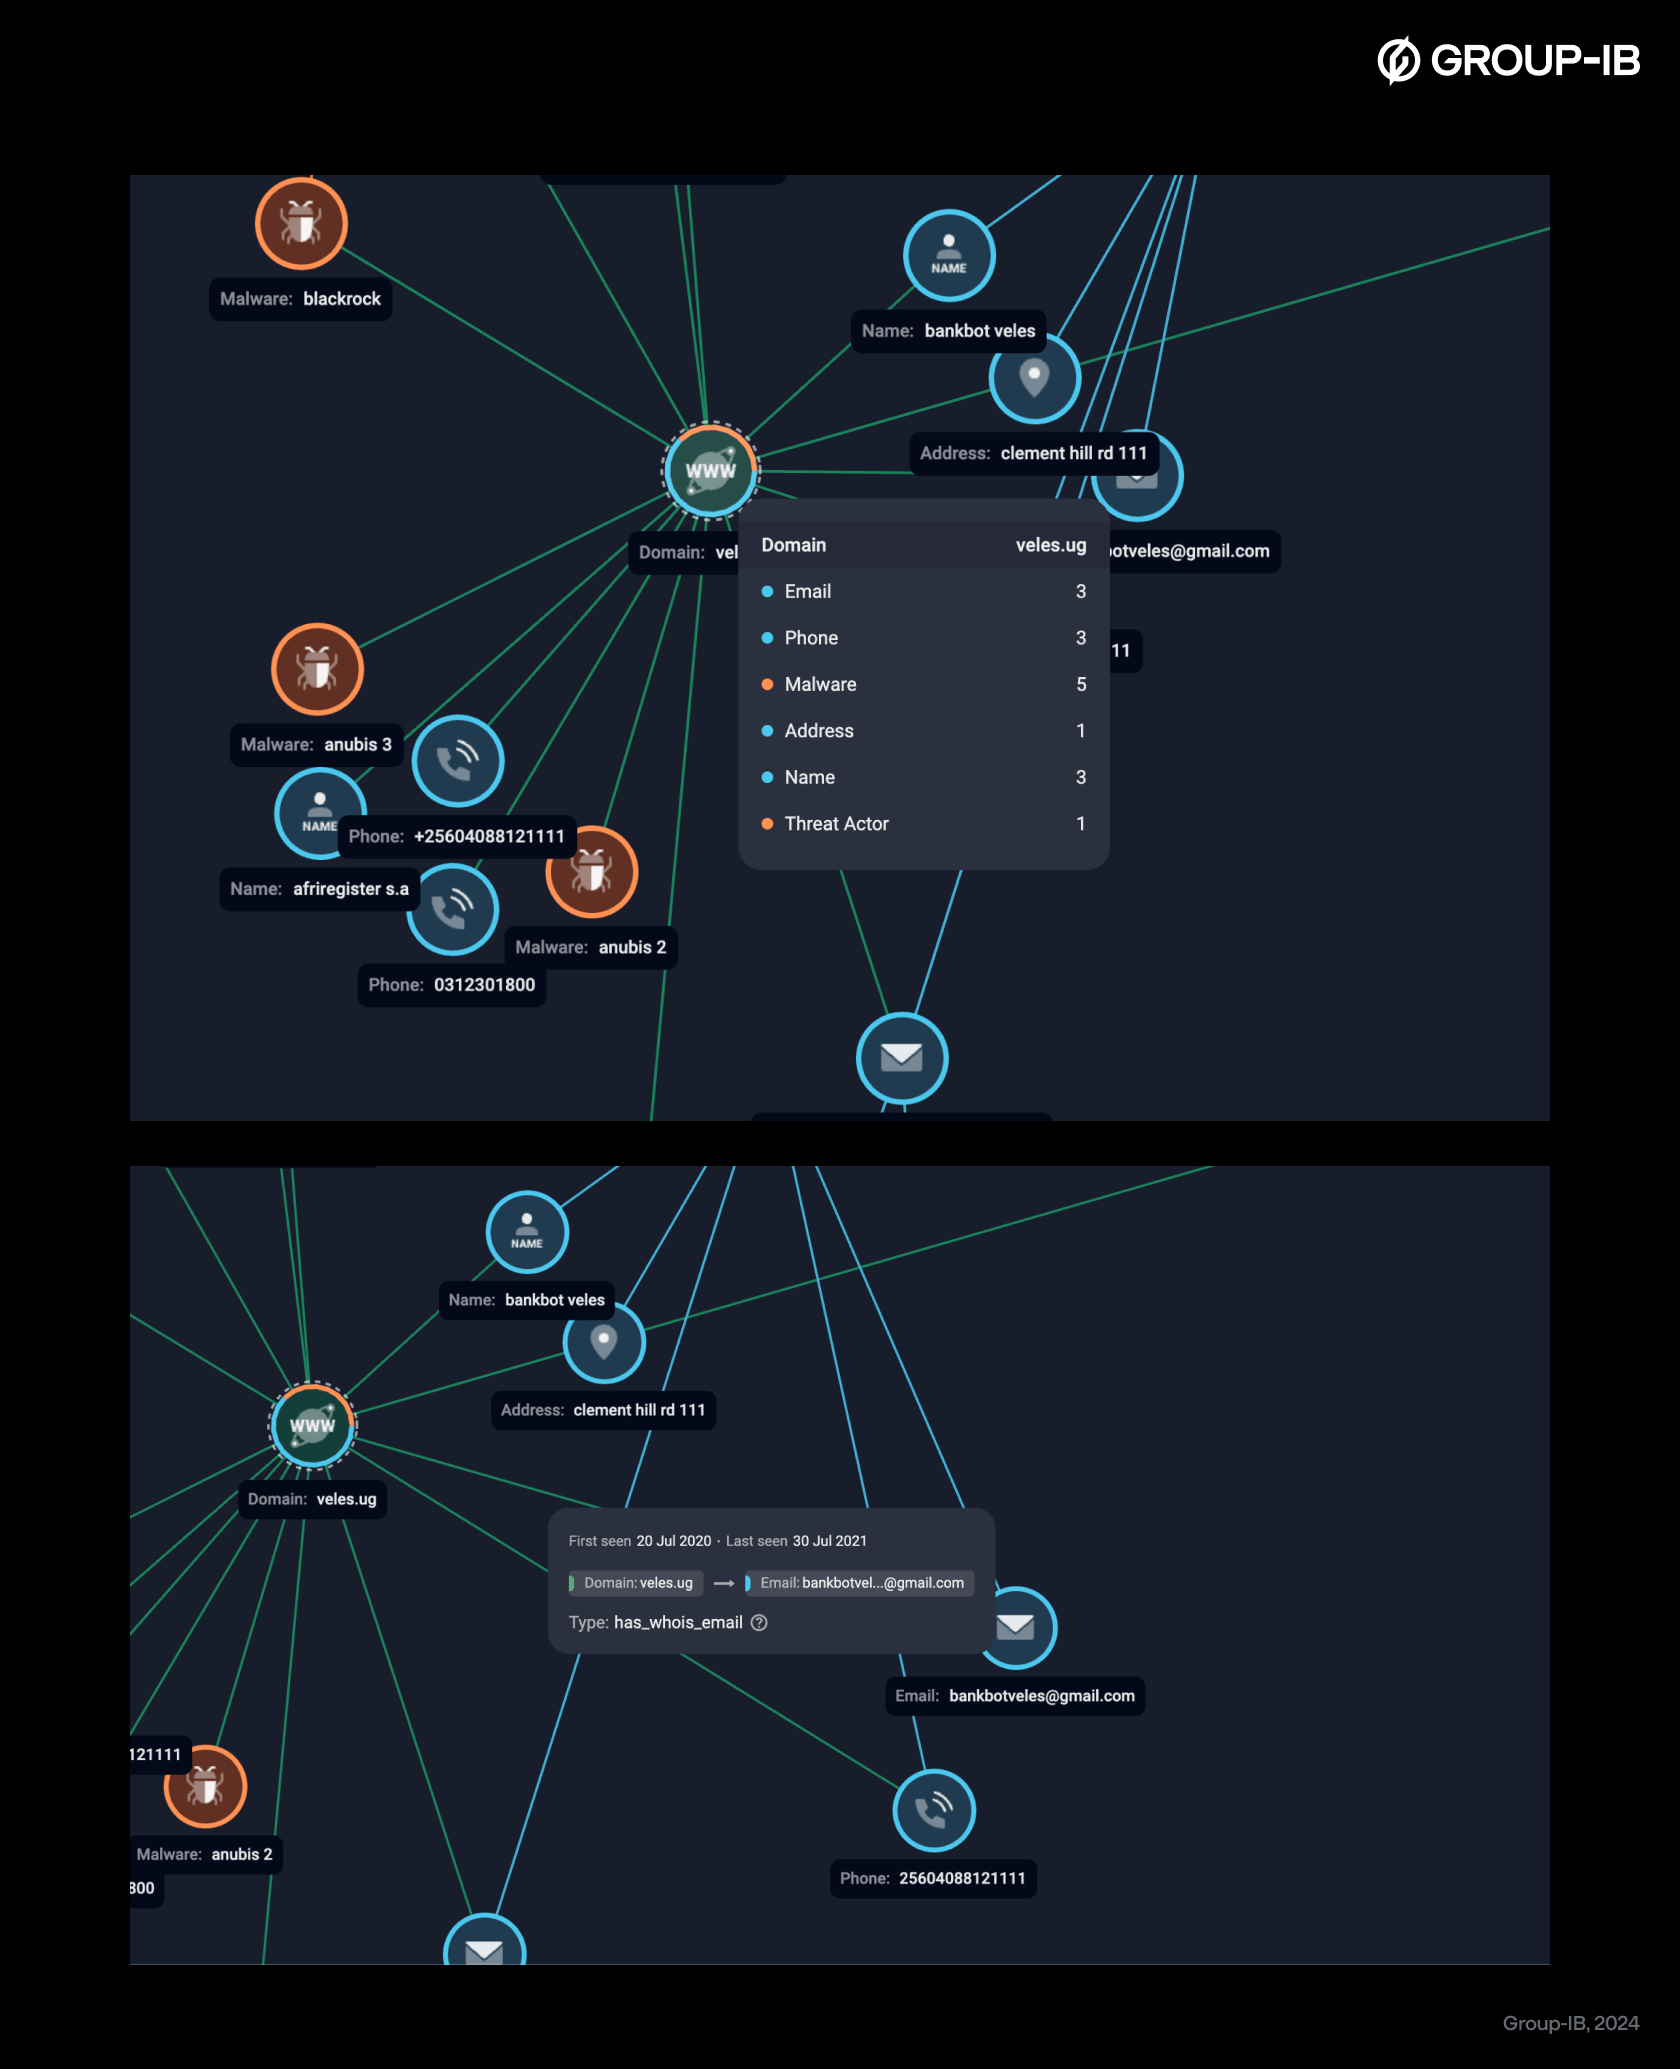
Figures 4-5. Pop-ups
We have also freshened up the color scheme, making complex datasets easier to follow with visual cues that help you track relationships. The sidebar has been compacted and made flexible to fit your workflow, and transparent-background screenshots make documentation and reporting a breeze. It’s all about helping you get to what matters most, without any fuss.
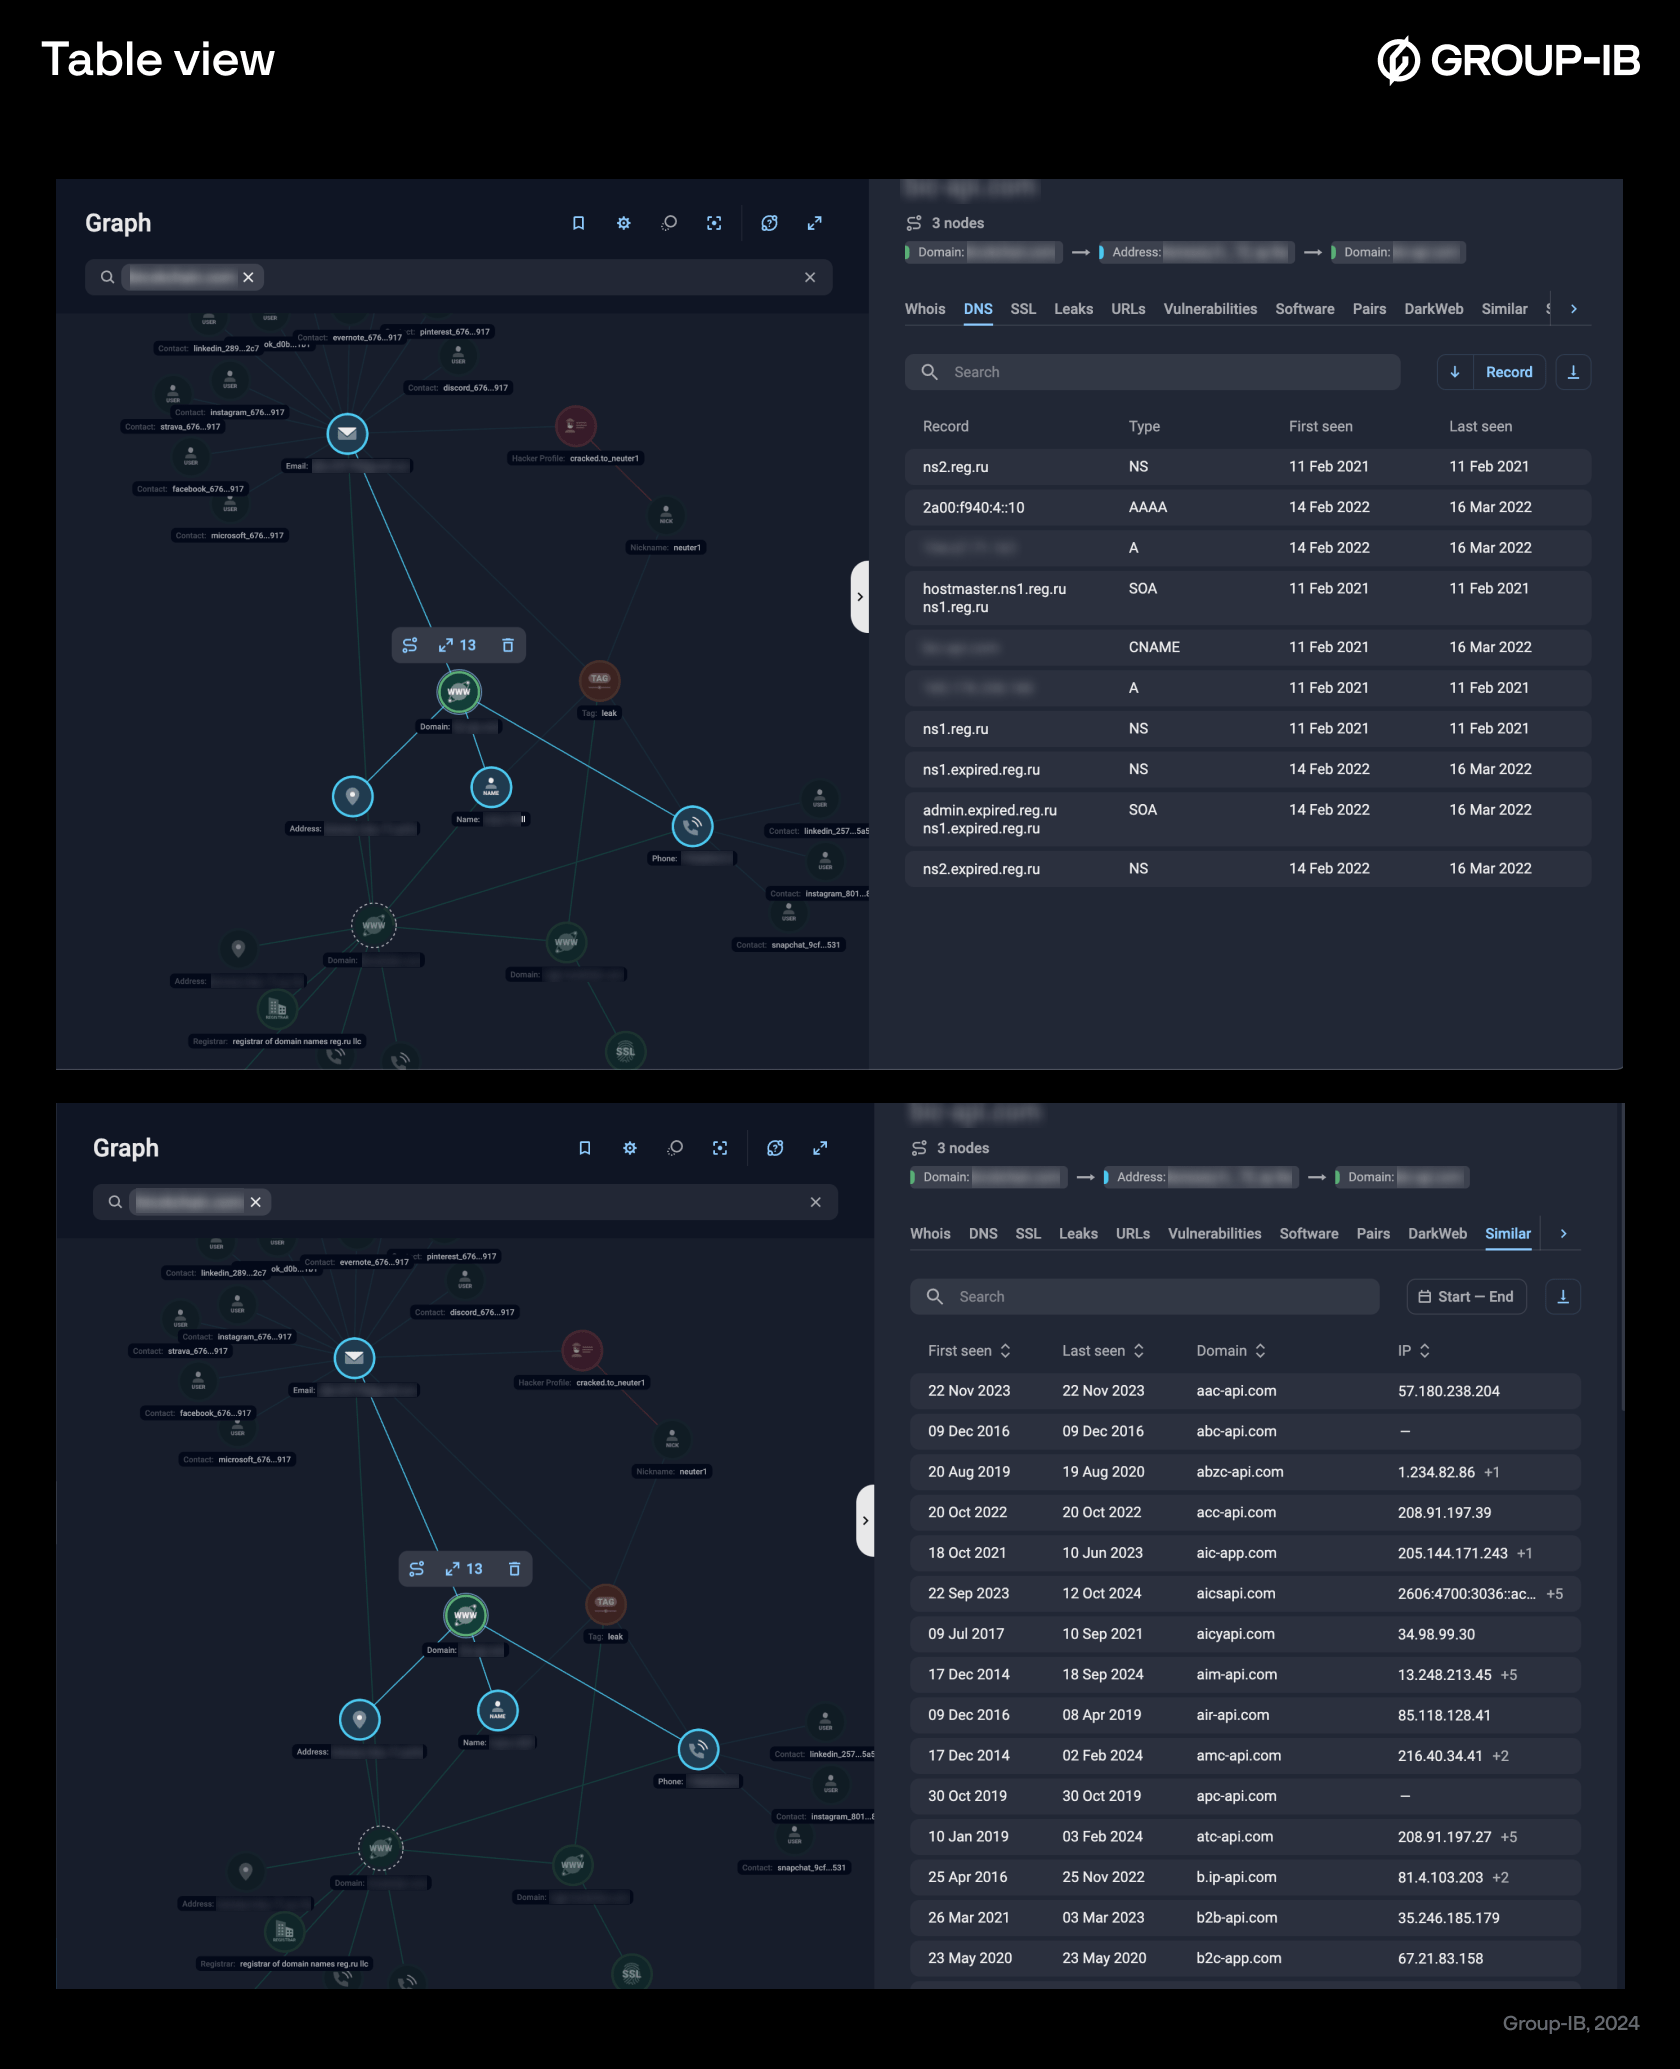
Figures 6-7. Table view
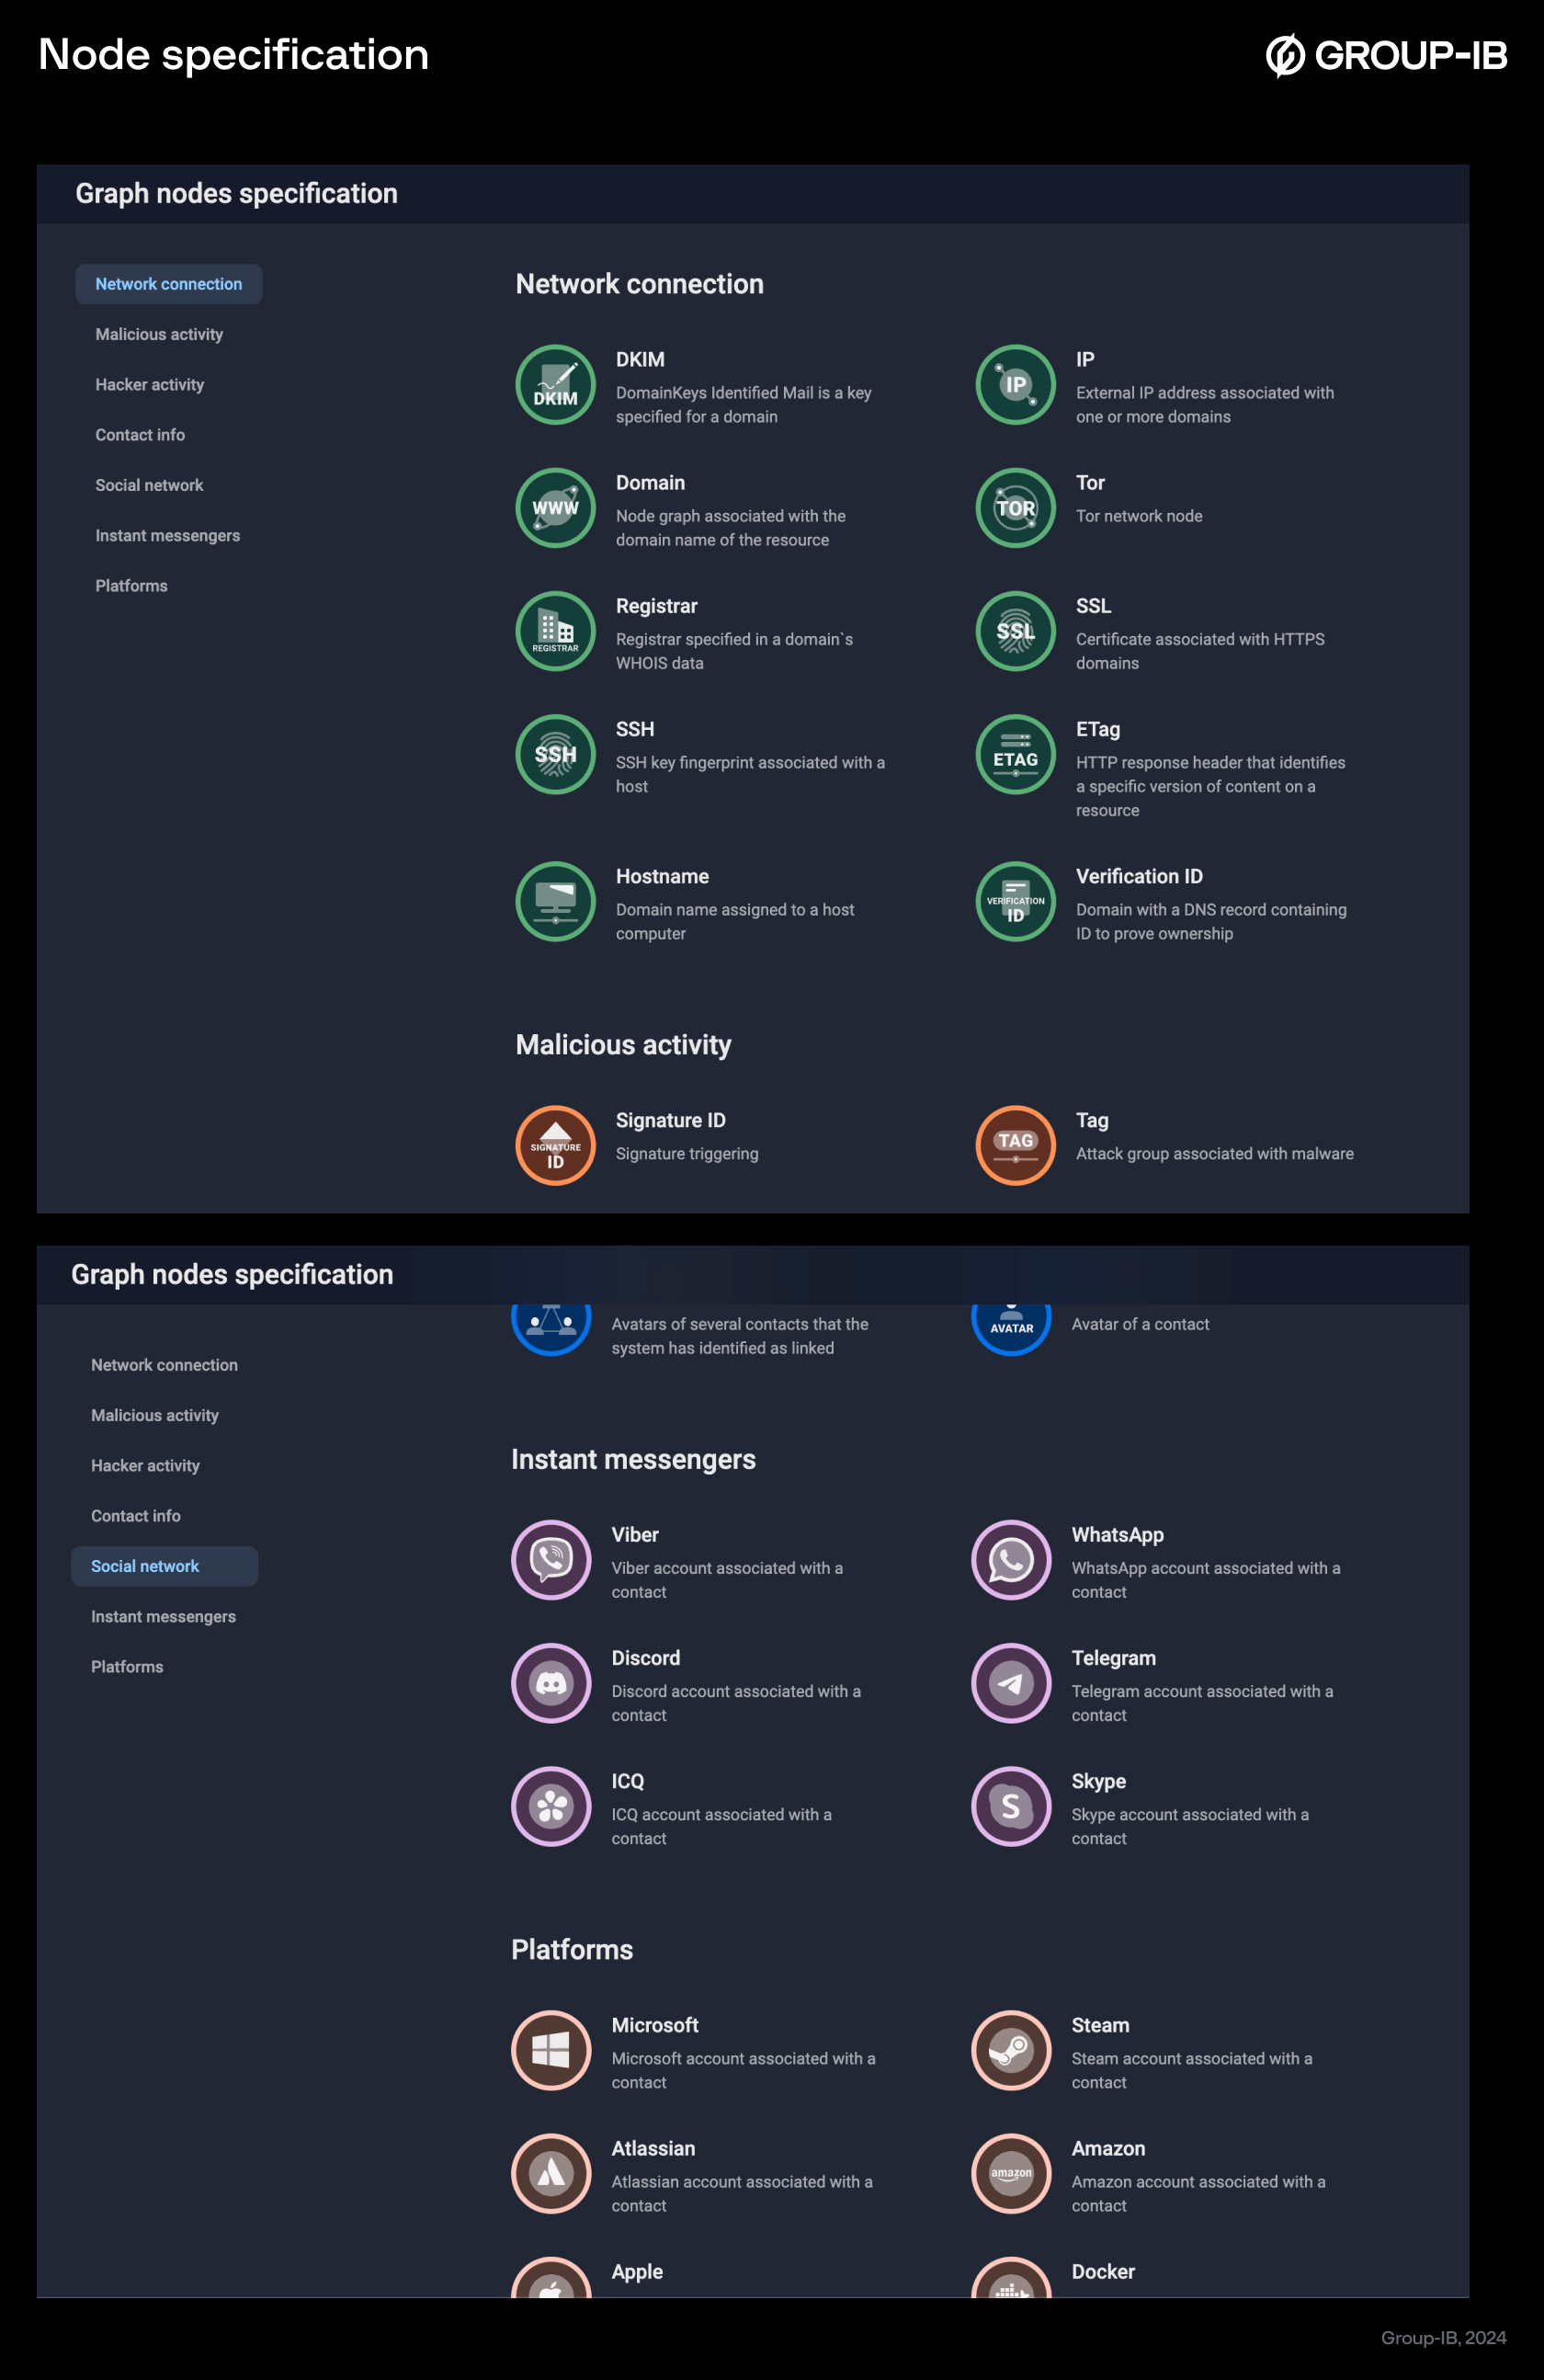
Figures 8-9. Node specification
Transition and attribution: Bridging the gap between criminal personas
The challenge solved: Connecting the digital footprint left by cybercriminals to their personal lives
Having handled over 1,500 investigations worldwide, we have observed a striking pattern: many cybercriminals maintain dual identities — a “black” side tied to their illicit activities and an “ordinary” side that reflects their day-to-day lives. Our research digs into various data points like domains, IP addresses, dark web profiles, and social media accounts. Some clues lead us directly to the criminal persona, while others point to the more mundane aspects of a criminal’s life.
The main goal of our investigations is to bridge the gap between these two sides. Group-IB’s redesigned Graph merges network analysis with social media insights, which helps to connect the dots between a threat actor’s digital infrastructure and their real identity. This transition is Group-IB’s unique feature and key to solving many cases and ultimately attributing and identifying criminals, which has become more efficient by adding new sources of data to Graph. Let’s dig deeper into what has been added…
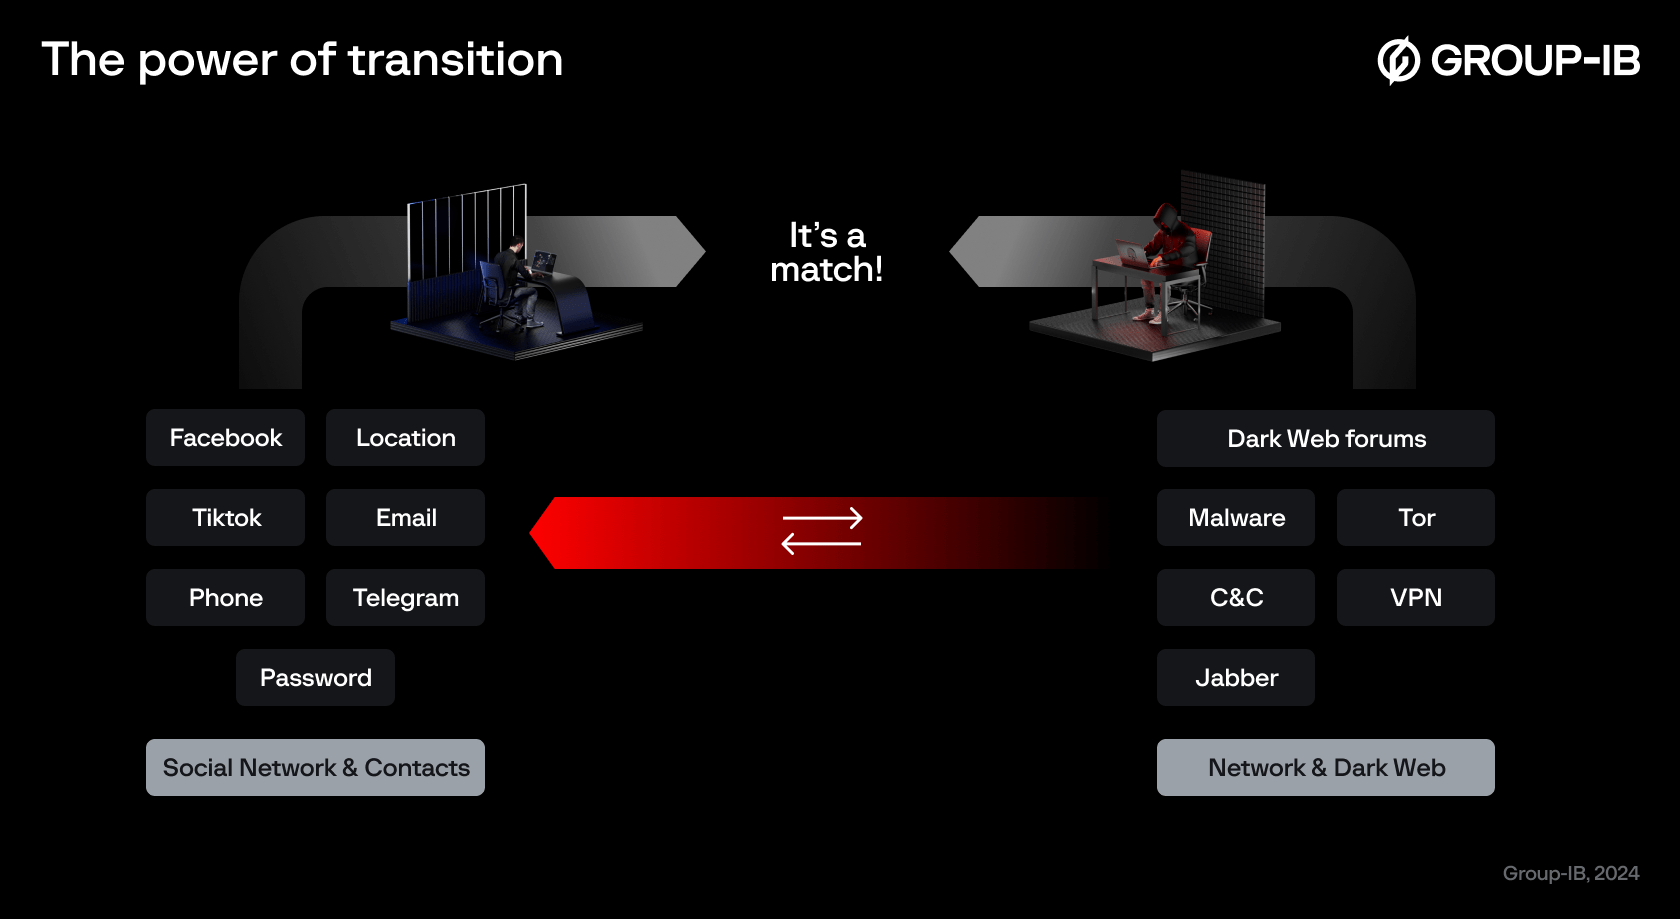
Figure 10. The power of transition
New data sources for enriched context
The challenge solved: Lack of valuable context and difficulty in understanding complex adversary behavior
To enrich Graph’s investigative power, we have integrated numerous data sources, including dark web information, public data breaches, website source code and snapshots. Let’s explore how this expanded range helps to look beyond surface-level connections and dive into the full context of each relationship.
One of the newest additions to Graph is a feature that leverages the proven technology of Group-IB’s Unified Risk Platform to proactively hunt for phishing sites. This feature functions much like a web crawler, scanning the internet to retrieve and analyze URLs. The tool captures site source code, generates real-time website screenshots, and extracts valuable data from the page code — information such as site services, embedded identifiers, and link destinations. This feature plays a key role in investigations by collecting in-depth information about website behavior and content, revealing links, resources, and redirects associated with a URL and by identifying potential threats like phishing attempts or malware distribution.
The feature goes a step further by detecting specific signatures of malicious activity, such as phishing kits or administrative panels, which are critical for identifying threats early. This capability helps to swiftly uncover linked resources across domains, identify and take down phishing infrastructure, and see what a website looked like in the past, giving analysts both a real-time and historical perspective on cybercriminal operations. Such an approach provides a complete view of cybercriminals’ digital infrastructure and reveals their tactics, techniques, and procedures (TTPs), which helps to detect threats earlier and attribute them more accurately.
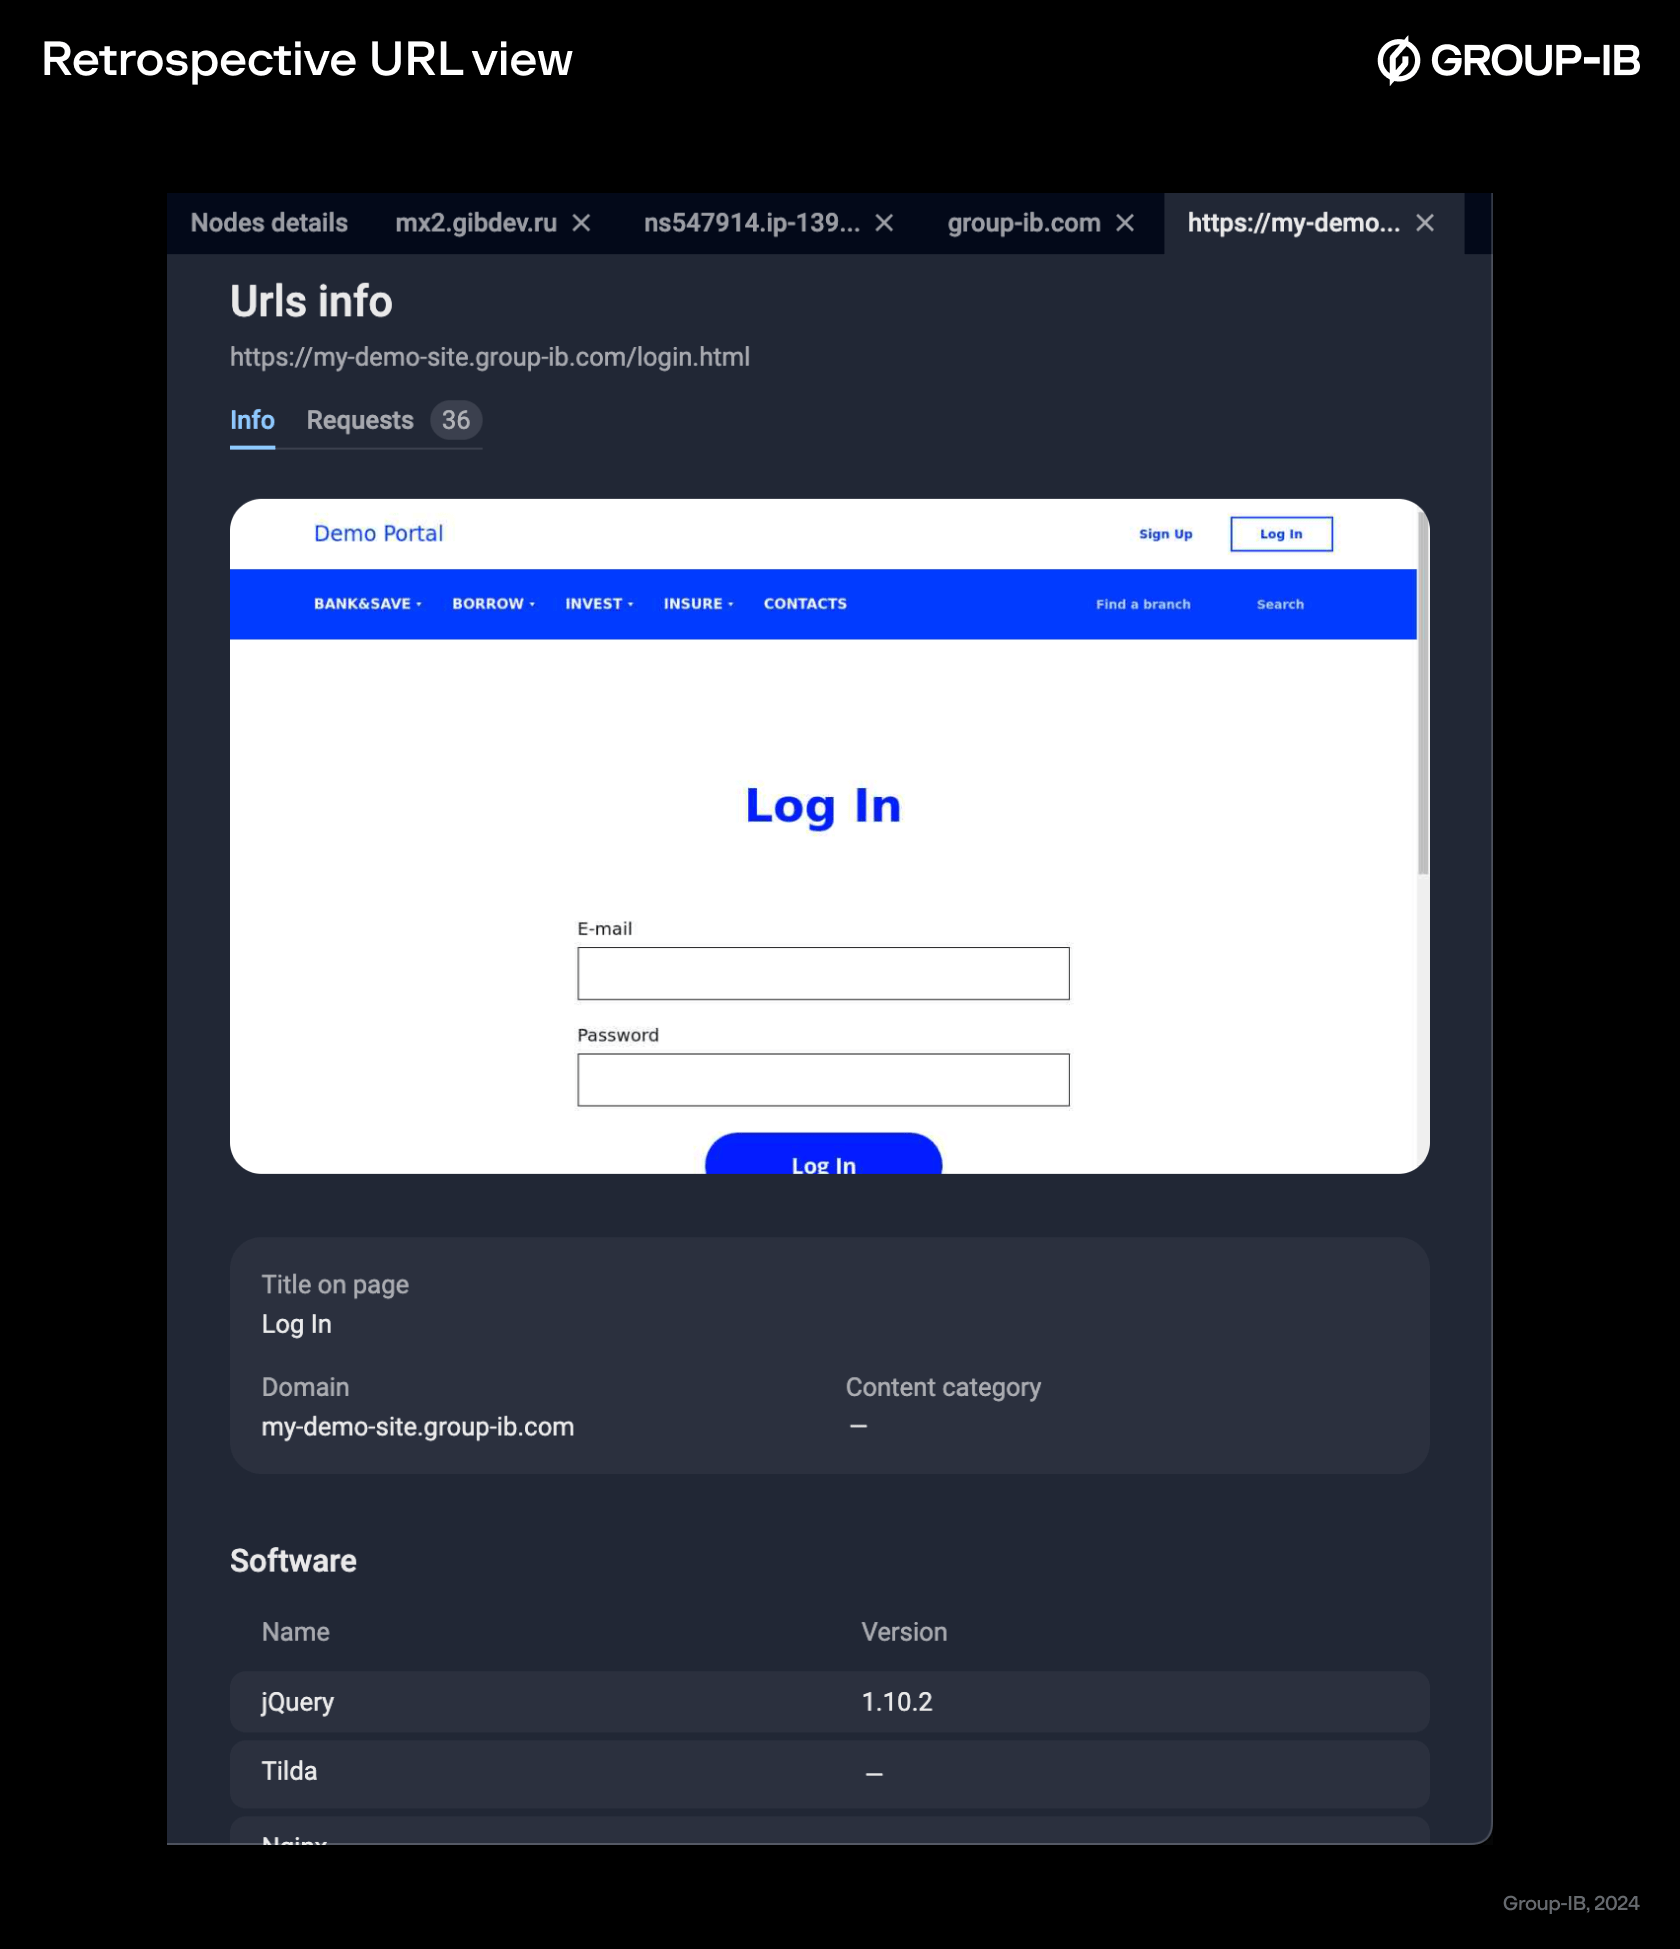
Figure 11. Retrospective URL view
Integration of public data breaches
The challenge solved: The need to obtain more context in order to discover breaches and identify perpetrators behind them
With the integration of publicly available data breaches into Group-IB’s Graph, analysts gain new tools to trace and understand cyberthreats. They can now identify which breaches contain a certain indicator of compromise (IOC) and view detailed information, such as who published the breach and the forum where it was shared. The added context helps cybersecurity specialists trace the breach’s origin and link it to specific threat actors or underground communities.
Public data breaches provide essential insights into cybercriminal tactics, exposed assets, and other compromised details. By analyzing such breaches, analysts can uncover relationships between threat actors, map attack vectors, and strengthen their overall security strategy. The patterns found within these breaches also enable teams to anticipate and prevent future threats.
This new data source greatly expands the investigative power of Group-IB’s Graph and offers a new layer of actionable intelligence. With the ability to cross-reference breach content, publication details, and forum associations, analysts can quickly connect attacks to their sources, making investigations faster and more accurate.
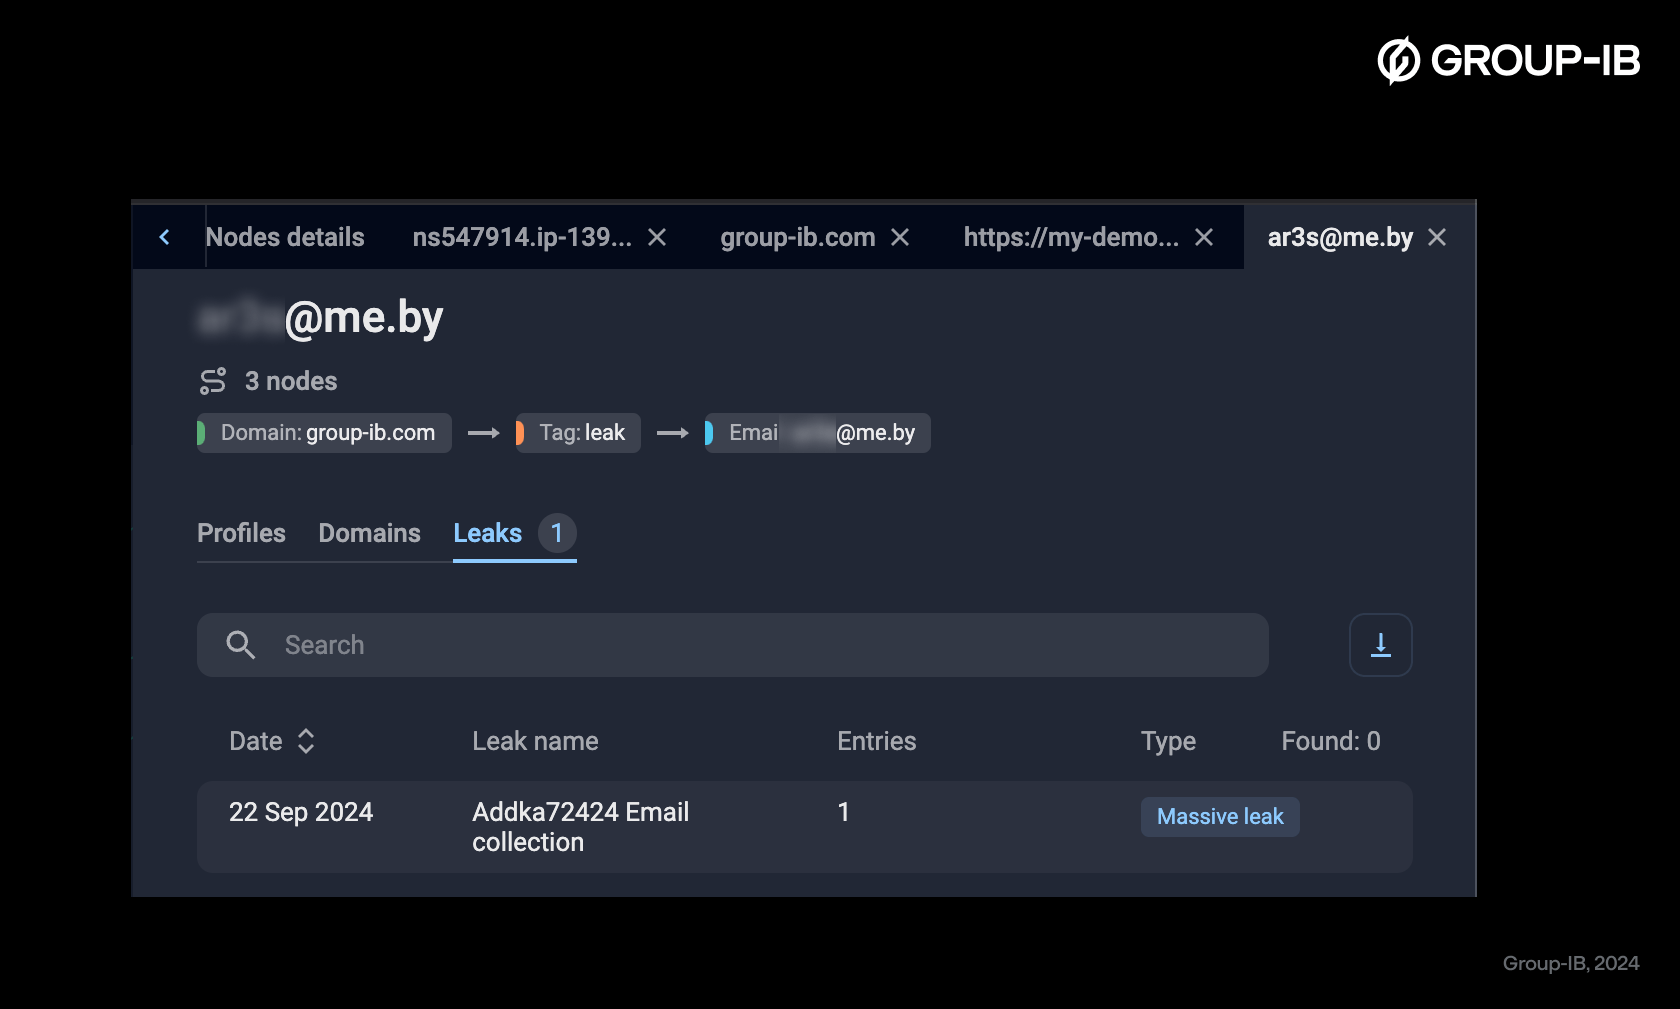
Figure 12. The list of massive breaches associated with the node
Expanded dark web insights and sidebar context
The challenge solved: Tracing complex relationships and critical connections within a limited period of time
Our new approach to handling dark web data within Group-IB’s Graph brings depth and clarity to investigations. Users can now view dark web messages mentioning certain IOCs, right in the Graph interface, which gives immediate insights into how these indicators are linked to illicit activities. In addition, it is possible to access profiles of dark web users or resources associated with the indicators, which adds valuable context and uncovers connections within the criminal ecosystem. This new dark web-related functionality makes it quicker to identify key players and their operations and makes it easier to track illicit activity across multiple platforms.
The updated sidebar provides a comprehensive view with insights into URLs, similar domains, subdomains, and massive breaches. The domain tab now also includes related domains and host pairs, which helps analysts to quickly identify interconnected assets within the same infrastructure or a threat network.
These improvements, alongside optimized graph-building and data-cleaning algorithms, make data processing faster and smoother, enhancing both visual analysis and usability. By adding such advanced data points, Group-IB’s Graph enables analysts to uncover hidden links, map the scope of malicious operations, and streamline attribution and threat identification with more accuracy and efficiency.
Case management at the core
The challenge solved: Seeing the picture from a historical perspective, checking the investigation’s progress, and sharing it with other teams
Even seemingly unrelated cases can be connected, and any piece of information can be pivotal in an investigation. Without suitable tools, however, even seasoned specialists may struggle to see the entire picture. Aware of these obstacles, we have introduced a new feature called Case Management, designed to enhance how analysts organize and manage investigations. With this feature, users can now save graphs in their current state, documenting each stage of an investigation as it unfolds. Whether specific nodes are removed or expanded, analysts can track changes over time and add titles and comments to provide context for each saved graph.
Apart from that, Graph now automatically detects tags of critical elements, such as threat actors and malware, within the saved graph. This enrichment helps analysts quickly identify and track key case components, reveals connections between them, and provides a more structured approach to complex investigations. Associating such insights with the saved profile makes it possible to seamlessly structure, track and revisit findings over time.
To improve user experience, we have introduced an auto-save feature. Graph automatically saves work at set intervals or after each action. You don’t have to worry about losing progress if you accidentally close a tab or if the browser crashes. This means that investigations are continuously preserved and analysts can pick up right where they left off without interruption.
Together, the updates within the Case Management feature make investigations of complex cases more organized and efficient, thereby improving productivity and the overall investigative experience. Analysts can now track their work more easily, find relevant cases quickly, avoid disruptions, and maintain control over every detail of the investigation.
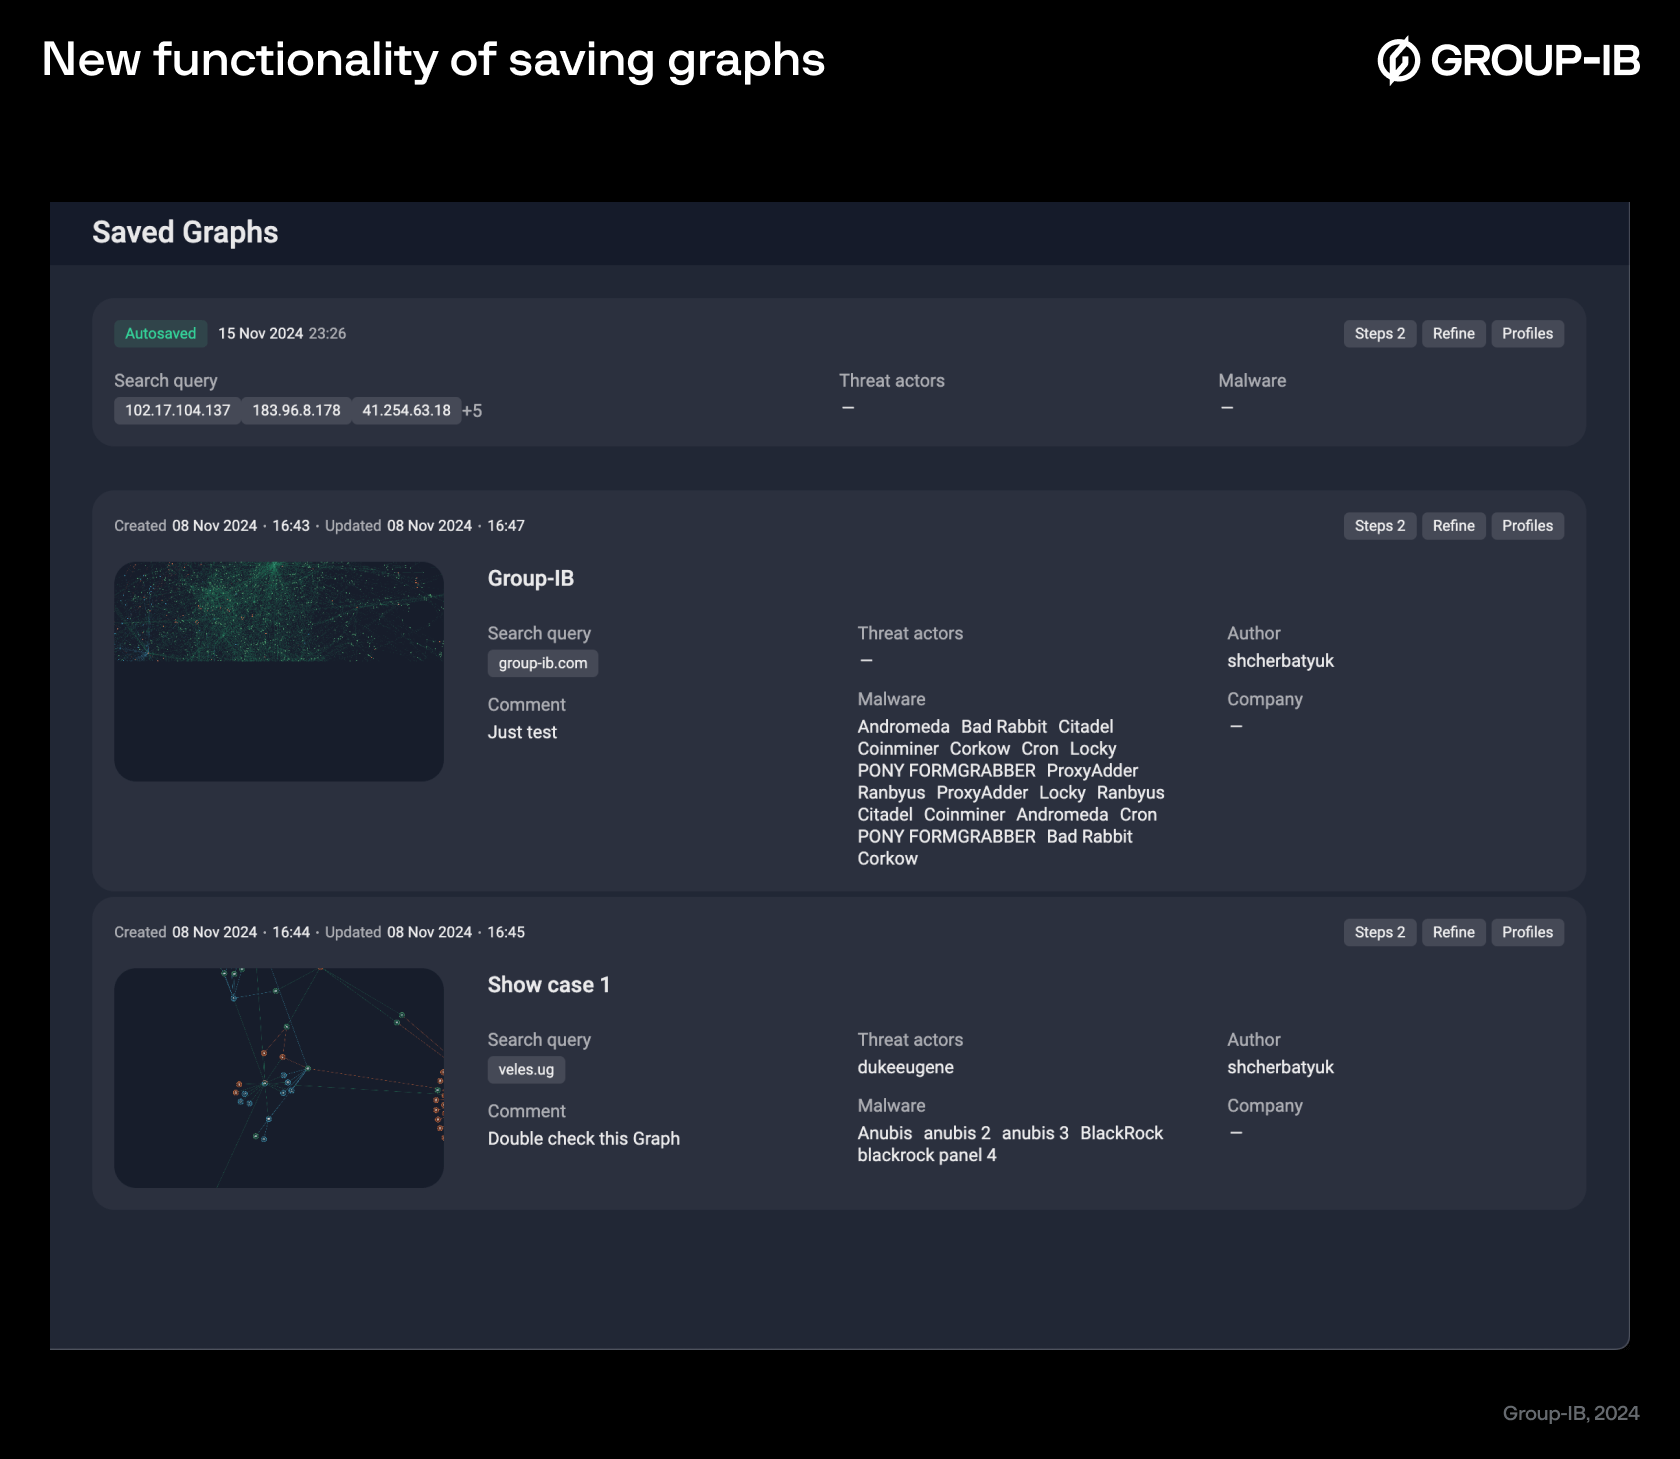
Figure 13. New functionality of saving graphs
Key milestones to reach with the reinvented Graph
Building on the previous version, the new iteration of Graph has evolved into a highly advanced tool for investigating and preventing cybercrime. Here’s exactly how you can leverage the redesigned Graph:
|
Visualize сomplex relationships Cybersecurity teams can leverage Graph to gain a clear, visual way to understand complex relationships between various data points such as IP addresses, domains, emails, dark web usernames, servers, and user profiles, simplifying the investigative process. |
Automate investigative steps
By automating the process of revealing connections (such as matching usernames or identifying related domains), Graph makes investigations faster and more efficient, reducing the manual burden on analysts.
|
| Handle large volumes of data
With cybercrime investigations growing more and more complex, Graph manages large volumes of data as effectively as possible. It helps analysts not only collect and organize data but also navigate it in a way that makes it possible to find critical patterns and gain valuable insights. |
Adapt and integrate
Graph integrates various types of data (such as emails, social media profiles, and crypto wallets) and provides flexible investigative paths, allowing analysts to investigate two sides of the same coin — a threat actor’s criminal activities and their day-to-day life. |
| Focus on long-term use and scalability
The tool saves investigation results for future use, recognizing that some findings might not be immediately useful but could be critical in future cases. Scalability is another key benefit, as investigations often grow in complexity over time. Graph now also supports data and graph sharing across teams. |
|
How you can leverage Graph through Group-IB products
Group-IB’s Graph technology has been an essential tool for our clients, from security teams to fraud detection units. Its core strength lies in its ability to take large, unstructured data sets and convert them into coherent, visual insights, uncovering critical links between IP addresses, domains, threat actors, indicators of compromise (IOCs), and more. But it’s not just about visualizing connections; it’s about revealing hidden risks, unknown vulnerabilities, and undetected threats lurking within your network. Whether you’re identifying threat patterns, discovering hidden assets, consolidating your view of digital risks, or hunting for unknown threats, our Graph has you covered.
With significantly higher R&D investments than the industry average, Group-IB has expanded its technologies, use cases, and services to provide organizations with custom offerings and cutting-edge solutions.
– Frost & Sullivan’s 2023 Competitive Strategy Leadership Award
| Threat Intelligence
↙↓↘ |
Attack Surface Management
↙↓↘ |
Digital Risk Protection
↙↓↘ |
Managed Extended Detection and Response
↙↓↘ |
| Detect when interactions or associations were last observed, which indicates whether a threat is active or historical | Identify all the components of your infrastructure (e.g., domains, IP addresses) | Map violations and connect related incidents and campaigns | Verify false positives |
| Map relationships between IPs, domains, IOCs, and known threat actors | Visualize your infrastructure in real time | Check and whitelist legitimate infrastructure | Search for additional indicators during an ongoing attack |
| Link malware hashes to threat actors and the IPs/domains distributing them | Analyze your external IT assets in detail (Whois changes, DNS, open ports) | Identify fraudsters and phishing kits | Attribute threat actors |
| Identify common services or infrastructure among threat actors or malware families | Detect hidden vulnerabilities | Create new signatures based on secondary indicators | |
| Gather usernames, emails, and other insights from dark web forums | |||
| Reveal compromised data and possible entry points into company networks |
What does this mean for you?
For cybersecurity specialists, our redesigned Graph means faster and more accurate investigations. With Graph, you can visualize complex cyberattacks in a matter of seconds and see how all the puzzle pieces fit together.
For businesses, it means better protection and higher operational efficiency. Whether you’re defending against phishing campaigns, protecting against fraud, or securing your digital assets, Graph equips your teams with the insights they need to stay one step ahead of cybercriminals.
If you’re already using our Threat Intelligence, you’re in luck — the new Graph is already part of your toolkit. Over the next few months, we’ll be rolling it out to Digital Risk Protection, Managed Extended Detection and Response, and Attack Surface Management users as well. Not a customer yet? Not a problem. Reach out to our team for a demo and we’ll show you how Graph can transform the way you approach cybersecurity.
At Group-IB, we believe that cybersecurity should be proactive, not reactive. With our enhanced Graph, we’re putting the power to anticipate, visualize, and stop cyber threats directly into your hands. Are you ready to see the whole picture?
Contact us
for a demo and experience the future of cybersecurity investigations.


