


Throughout years of investigating phishing, botnets, fraudulent transactions, and cybercriminal groups, Group-IB experts have used graphs to detect such threats. Each case has its own set of data, its own algorithm to establish links, which can be visualized in a graph, an instrument that once used to be Group-IB’s internal tool, available only to the company’s staff.
Network graph analysis became Group-IB’s first internal tool to be incorporated into the company’s public products – Threat Intelligence, Managed XDR, Secure Bank and Fraud Protection service. Before creating the network graph, we analysed several solutions available on the market and failed to find a single product that met our expectations. In this article, we describe how we created the network graph, the ways in which we use it, and the challenges it presents.
What can be achieved thanks to a network graph?
Investigations
Since Group-IB was established in 2003, the company’s top priorities have been identifying and de-anonymising criminals and bringing them to justice. With time, all cybercrime investigations came to be carried out at the same time as analysis of attacker network infrastructure. In our early years, this analysis was a painstaking ordeal to establish links that might help identify criminals, i.e. information about domains, IP addresses, and server fingerprints.
Most attackers do their best to remain anonymous online. Like everyone else, however, they make mistakes. The main goal of network graph analysis is to track down projects that cybercriminals carried out in the past — legal and illegal projects that bear similarities, links in their infrastructure, and connections to the infrastructure involved in the incident being investigated. In illegal projects, a threat actor aims to hide their identity, but all the hackers are ordinary people and some of them might also have some legal projects online – forums or ecommerce websites. If a cybercriminal’s previous legal project is detected, identifying him or her becomes simple. If only illegal projects are detected, however, it takes much more time and effort to identify the cybercriminals because they always attempt to anonymise or hide registration data.
Nevertheless, our chances of identifying the hackers remain high. As a matter of fact, hackers pay less attention to their personal security and make more mistakes when they first embark on their criminal path, which means that the success of our investigation depends on how far the traces we find date back to. That is why graphs with in-depth retro-analysis are crucial in such investigations. In short, the more historical data a company has, the more effective its graph will be. For example, the data for a five-year period could help solve one or two crimes out of ten, while data for a period of 15 years could help solve all ten crimes.
Detection of phishing and fraud
Every time we detect a suspicious link to a phishing, fake, or pirated website, we create a graph of linked web resources and check all the detected hosts for similar content. This helps us find both old phishing pages (which remained active but undetected) and new phishing pages (which were created for future attacks but have not been used yet). A common example: we find a phishing website belonging to a server that hosts five websites and a quick check shows that all the remaining pages have phishing content as well. As a result, we block five web pages instead of one.
Search for backends
This process is necessary to find out where the malicious server is located. As much as 99% of cardshops, underground hacker forums, phishing pages, and other malicious servers use both their own proxy servers and proxy servers provided by legitimate services, including Cloudflare. Information about a genuine backend is extremely important for incident response: as soon as a hosting provider is identified, we are able to seize the malicious server and establish links with other malicious projects.
For example, we find a phishing site that collects bank credentials and resolves to the IP address 11.11.11.11, and a cardshop page that resolves to IP-address 22.22.22.22. As a result of the analysis, we might find out that the phishing page and the cardshop have the same backend IP address, e.g. 33.33.33.33. This information helps us establish links between the phishing attacks and the cardshop, which might be used to sell the compromised credentials.
Event correlation
When we come across two different types of alerts (IDS alerts, for example) involving the use of different malware and C&C servers, we usually view them as two independent events. If there are strong links between two malicious infrastructures, however, it becomes obvious that these are not two independent attacks but the stages of a single multiphase attack. If one of these attacks has already been attributed to a cybercriminal group, the same can be done with the second attack. The fact that the attribution process is far more complicated should be taken into account, and this is just one example.
Indicator enrichment
This matter does not require too much attention given that indicator enrichment is the most common scenario for the use of network graph analysis in the cybersecurity world: there is one indicator at the input and a set of linked indicators at the output.
Pattern identification
Pattern identification is essential for effective threat hunting. Graphs help researchers not only find linked elements but also determine common features that characterise a given cybercrime group. Knowledge of such unique characteristics helps cybersecurity researchers identify attacker infrastructure at the preparation stage and without evidence confirming the attack, such as phishing emails or malware.
Why did we create our own network graph?
It is worth reiterating that we considered solutions designed by various companies with the view to adopting them as part of our work before we decided to create our own tool that would be capable of something no other solution could do. It took several years to develop it and we have since completely redesigned it, several times. Despite the considerable time it took us to create the network graph, we have no regrets: we have yet to find an analogue that meets all our expectations. Thanks to our own product, we eventually managed to solve all the problems detected in existing network graphs. Let’s take a closer look to these problems:
| Problem | Solution |
|---|---|
| Lack of provider with various sets of data: domains, passive DNS, passive SSL, DNS records, open ports, applications running on the ports, files that communicate with domain names and IP addresses. Explanation: Normally, providers offer only specific types of data and, in order to obtain a general picture, it is necessary to purchase subscriptions from various providers. However, even numerous subscriptions do not guarantee that all the data needed has been obtained: some passive SSL providers provide data only on certificates issued only by CA associates, while their coverage of self-signed certificates is extremely poor. Meanwhile, others provide data on self-signed certificates that are collected from standard ports only. | We gathered all the mentioned data sets ourselves. For example, to collect data about SSL certificates, we created our own service that gathers information from trusted CAs by screening the entire IPv4 address space. The certificates were collected not only from IP addresses but also all the domains and subdomains from our base. For example, if a certificate has a domain “example.com” and a subdomain “www.example.com”, both of which resolve to IP address 1.1.1.1, they might receive three different results while trying to obtain an SSL certificate from port 443 for the IP address, the domain, and its subdomain. To collect data on the open ports and running services, a separate distributed scanning system has been created given that other services frequently blacklisted IP addresses belonging to scanning servers. Our own scanning servers also sometimes get blacklisted, but our results in detecting the necessary servers are better compared to companies that simply scan as many servers as possible and then sell access to that data. |
| Lack of access to the entire database of historical records. Clarification: Each provider normally has a broad database, but we were unable to obtain access to all the historical records due to obvious causes. This means that it is possible to obtain the records for a specific element (a domain or an IP address) but not to see the whole range of data. | In order to collect as many historical records on domains as possible, we have purchased various databases, parsed data from open sources, and reached agreements with domain name registration services. All the updates in our own bases have been kept together with the entire history of changes. |
| All existing solutions allow for the creation of graphs in manual mode only. Clarification: For example, a number of subscriptions have been bought for all available data providers (they are usually called “enrichers”). When a graph is required, they manually issue a command to create links for a given element, after which they choose the elements from which to build further links. In such scenarios, the responsibility for the graph’s quality rests with a specific individual. | We have designed automated graph creation. This means that the links to the searched element are built in automated mode, while the researcher only specifies the number of steps. The automated process of graph creation is quite simple but other vendors refrain from using it since a graph built in automated mode includes a number of irrelevant results, which we had to take into account while creating our own graph (you can read about it below). |
| A number of irrelevant results is a problem with nearly all graphs. Clarification: For example, a malicious domain (involved in the attack) is linked to a server that developed links to 500 other domains over the past ten years. When a graph is created in manual or automated mode, all these 500 domains should be depicted on the graph, even though they have no relation to the attack. Or, for example, the IP indicator from a vendor’s security report is checked. Such reports are normally issued with a great deal of detail and contain information covering a year or more. It is highly likely that, when the report is read, the mentioned server with this IP address will be leased to other people with other links, while the graph created based on this information will contain irrelevant results. | We have taught our system to identify irrelevant results based on the logic used by our experts while addressing the matter manually. For example, the malicious domain “example.com” is checked and currently resolves to IP address11.11.11.11, while a month earlier, it used to resolve to IP 22.22.22.22. Apart from the domain “example.com”, the IP address 11.11.11.11 also has links to the domain “example.ru”, while IP address 22.22.22.22 has links to 25,000 other domains. Both system and individual understand that IP address 11.11.11.11 is likely to be a dedicated server since the spelling of the domain name “example.ru” resembles “example.com”, and it seems that they are both set to have links on the graph. The IP address 22.22.22.22, for its part, belongs to a shared hosting, which is why it is not necessary to include all of its domains in the graph unless there is some other link showing that some of these 25,000 domains also should be included in the graph (e.g. “example.net”). Before the system decides that the links found should be broken and some of the elements be excluded from the graph, it analyses several features of the elements and clusters that are made up of these elements, as well as the strength of these links. For example, if we have a small cluster (about 50 elements) that includes a malicious domain and a large cluster (5,000 elements) that are connected with a weak link, then such a link will be broken, while the elements from the big cluster will be deleted from the graph. Conversely, if the small and large clusters have many links with increasing strength, the links will not be broken, and the graph will contain the necessary elements from both clusters. |
| The period of server or domain possession is not taken into account. Clarification: The period of malicious domains registration eventually expires, and they are subsequently purchased again for fraudulent or legitimate goals. Even bulletproof hosting providers lease servers to hackers, which is why it is extremely important to know and take into account the period when a given domain or server was controlled by a specific owner. We often come across situations where a server with the IP address 11.11.11.11 is used as a C&C server for a banking bot, while a couple of months earlier it was used to control ransomware. If a graph is created without taking into account the so-called possession interval, it will look like the owners of the banking botnet and fraud scheme have a link, while in reality it does not exist. In our field of work, such a mistake is critical. | We have taught our system to determine possession periods. It is relatively easy in the case of domains given that services such as “whois” often mention the registration and expiration date, which means that it is easy to determine these periods when you have access to the entire history of changes on “whois”. In cases when the domain name has not expired but was handed over to other owners, the graph is able to see such changes. For example, SSL certificates are issued only once and cannot be extended or handed over to anyone else. However, when it comes to self-signed certificates, we cannot trust the validity dates as it is possible to generate an SSL certificate with a random validity start date. It is most difficult to establish possession periods for servers as the information about the lease term is only available to hosting providers. In order to establish possession periods for servers, we started using the results of port screening and fingerprinting applications running on those ports. This information helps us determine, with a high degree of accuracy, when a server changed its owner. |
| Few links. Clarification: Today, it is easy to obtain a list of domains linked to a specific email or IP address using free services such as “whois”. However, in the case of hackers, who take every measure possible to complicate being tracked and identified, additional tricks are necessary to uncover new features and build new links. | We have spent a considerable amount of time establishing how to extract data that is not available using ordinary means. We cannot reveal details for obvious reasons, but in some cases mistakes made by hackers during domain registration or server configuration help us discover their emails, pseudonyms, or backend addresses. The more links can be determined, the more accurate the graph will be. |
How does our graph work?
To start using the network graph, an IP address, an email address, or an SSL certificate fingerprint should be typed in the search bar. Analysts can regulate three parameters: the timeframe, the number of steps, and the refine option.

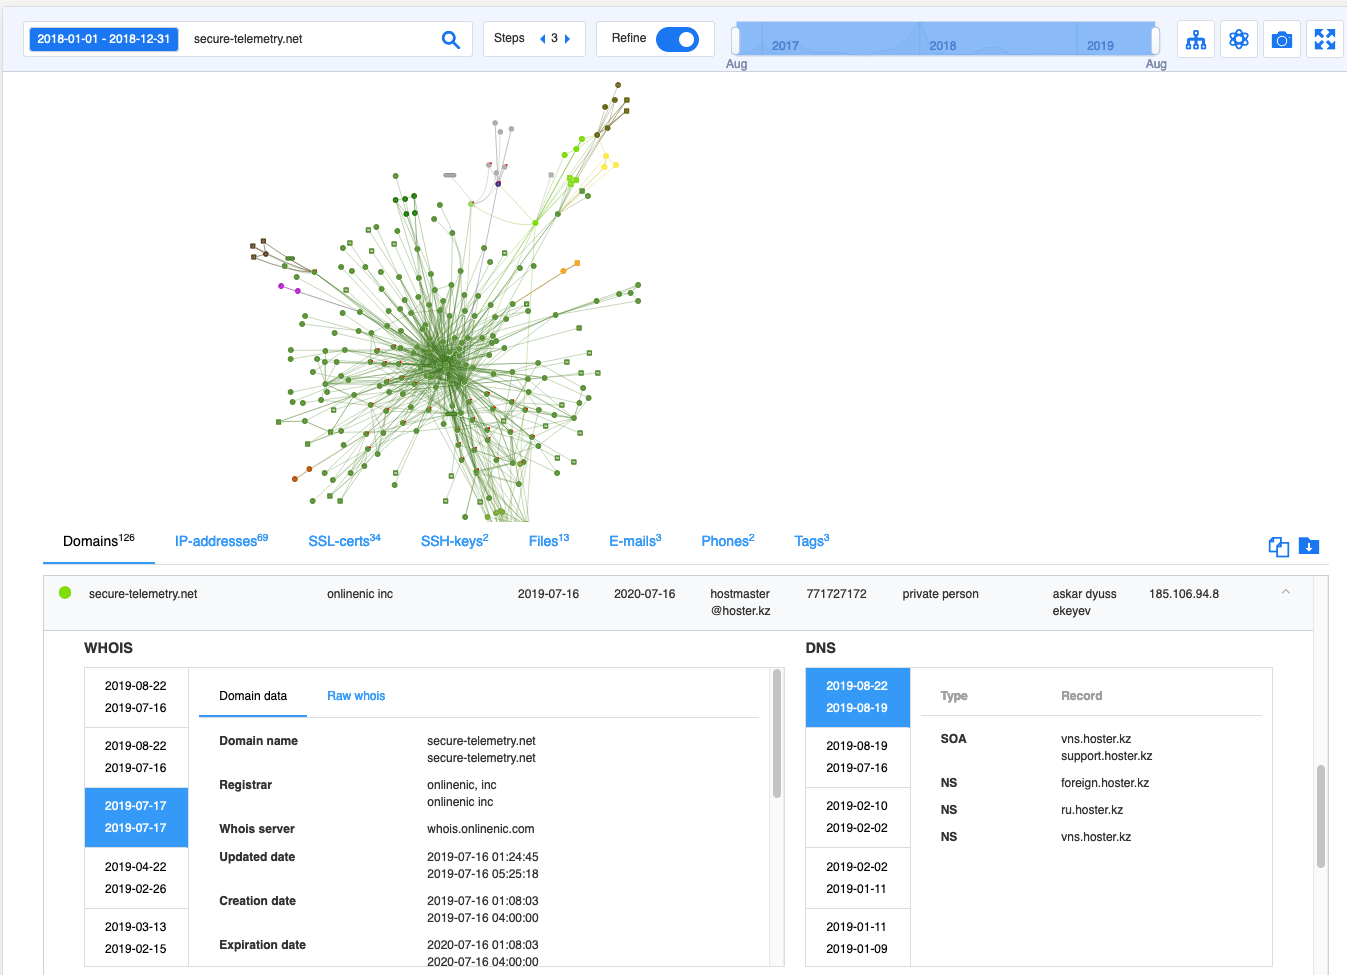
Timeframe
The timeframe is a specific date or a period when the searched element was used for malicious purposes. If this parameter is not defined, the system will determine the period when this web resource was controlled by cybercriminals for the last time. For example, on 11 July, Eset released a report about Buhtrap using a zero-day exploit for cyberespionage. In its paper, the company also included six indicators of compromise. One of them (“secure-telemetry[.]net“) was re-registered on 16 July. As a result, if you try to create a graph for the period after 16 July, the system will show irrelevant results. As soon as you specify that this domain was registered before that date, however, the graph reveals 126 new domains and 69 IP addresses that were not included in Eset report:
- ukrfreshnews[.]com
- unian-search[.]com
- vesti-world[.]info
- runewsmeta[.]com
- foxnewsmeta[.]biz
- sobesednik-meta[.]info
- rian-ua[.]net
- and others.
Apart from network indicators, we can also see links to malicious files related to this infrastructure and tags, which suggests that Meterpreter and AZORult were used.
What makes graph analysis so convenient is the fact that all this information is obtained in just a second and it is no longer necessary to spend days analysing data. This can save much time during incident response, which is always crucial.
Number of steps
The default number of steps set in the settings is three. This means that the searched element will be connected with all the elements that have direct links to it and each new element will then be linked to other elements, which in turn will be linked to the third series of elements.
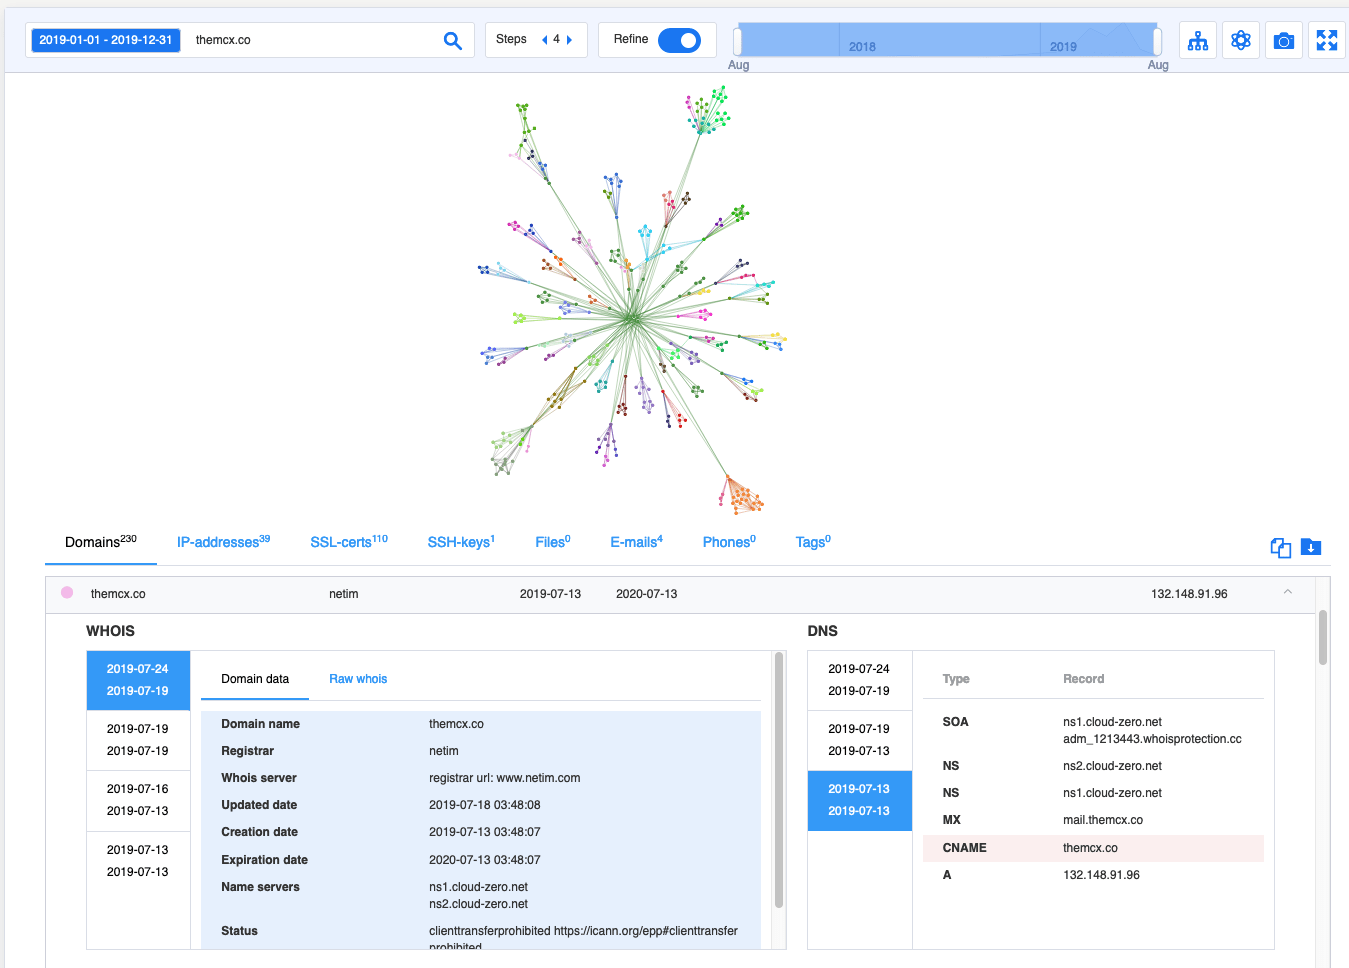
Let’s take the example that does not relate to APT or zero-day exploits. The technological website Habr has recently published a story about cryptocurrency fraudulent schemes. In particular, the report mentioned the domain “themcx[.]co”, which was used by cybercriminals to host what was disguised as Miner Coin Exchange, and “phone-lookup[.]xyz“, used to attract traffic.
The scheme used a large infrastructure to attract traffic to fraudulent websites. Group-IB decided to examine this infrastructure using a graph based on four steps. As a result, we obtained a graph with 230 domains and 39 IP addresses. We divided the domains into two groups: the first one for pages disguised as services linked to cryptocurrencies and the second for pages linked to generating traffic.
| Related to cryptocurrency | Related to traffic generation |
|---|---|
| coinkeeper[.]cc | caller-record[.]site. |
| mcxwallet[.]co | phone-records[.]space |
| btcnoise[.]com | fone-uncover[.]xyz |
| cryptominer[.]watch | number-uncover[.]info |
Refine option
In default settings, the refine option is active and removes all irrelevant elements from the graph. Coincidentally, it was used in all the above-mentioned examples. This begs an obvious question: how can we ensure that some crucial elements are not removed from the graph? Analysts who prefer creating graphs manually can turn “refine” off and use one step to build the graph. As a result, the analyst will be able to build the graph further and remove irrelevant elements from it.
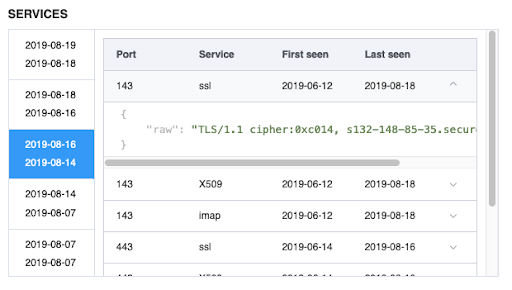
The built graph has some additional tools, namely the “whois” change history, DNS, and open ports and services launched within.
Financial phishing
Group-IB has monitored the activities of an APT group that launched phishing attacks on clients of various banks for several years. The defining feature of this APT group was registering domains resembling real names of banks, while the phishing pages had similar interfaces. The pages differed from each other through bank names and logos.
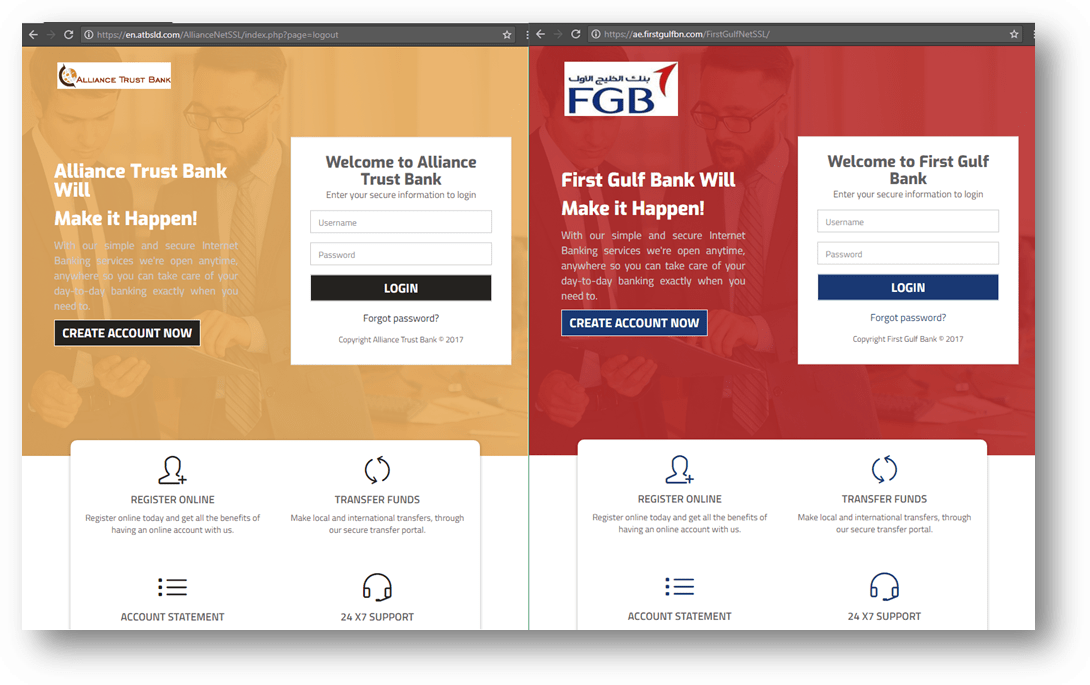
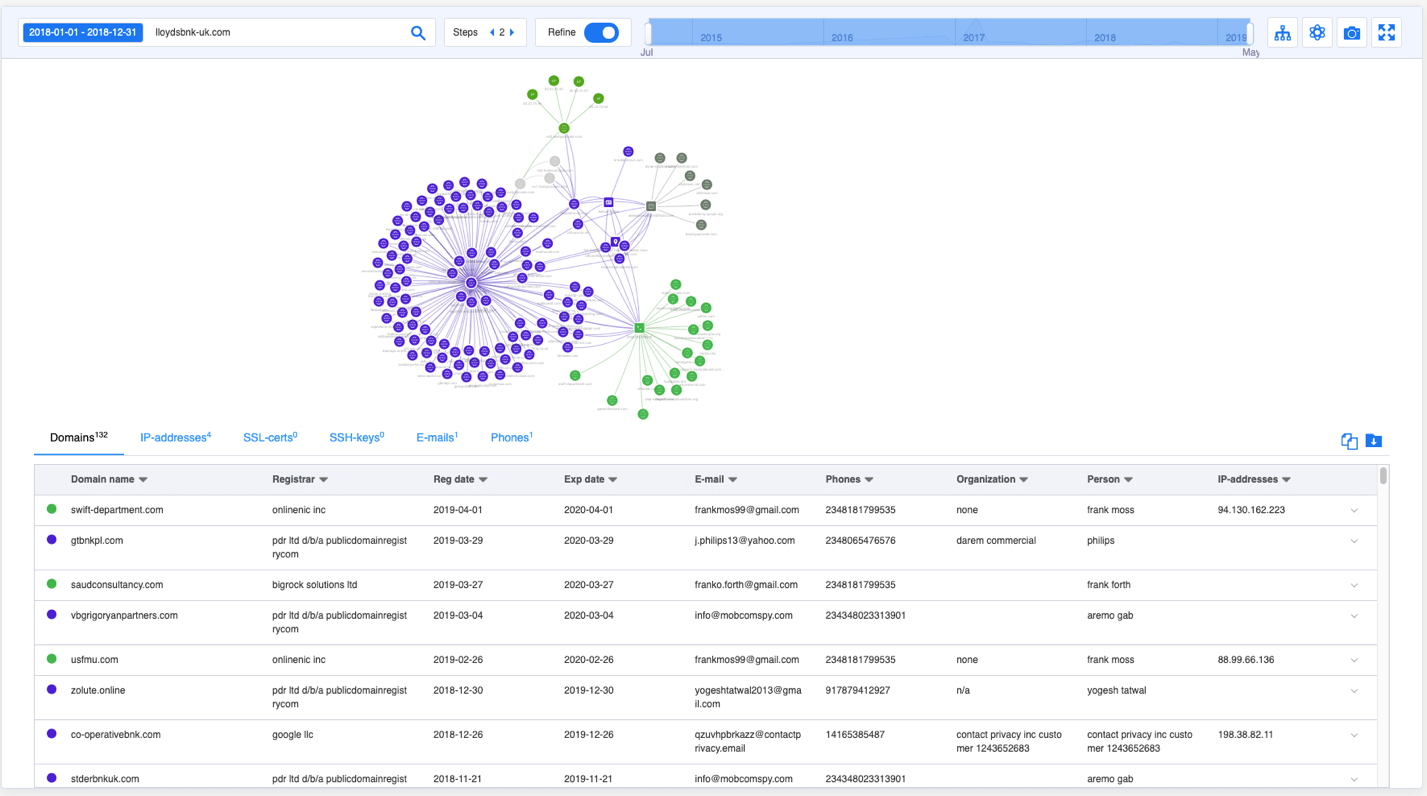
In this case, automated graph network analysis greatly facilitated our work. Based on the domain “lloydsbnk-uk[.]com“, we built a graph with three steps within seconds. The graph identified more than 250 malicious domains that the group had used since 2015. Some of the domains have been purchased by the banks, but their history shows that they used to belong to cybercriminals.
The picture shows a graph with two steps.
In 2019, attackers modified their tactics and started registering not only bank domains for hosting phishing pages but also domains of various consulting companies in order to subsequently send out phishing emails, namely swift-department[.]com, saudconsultancy[.]com, and vbgrigoryanpartners[.]com.
Cobalt gang attack
In December 2018, the cybercriminal group Cobalt, which specialises in targeted attacks on banks, sent emails purporting to be from the National Bank of Kazakhstan.
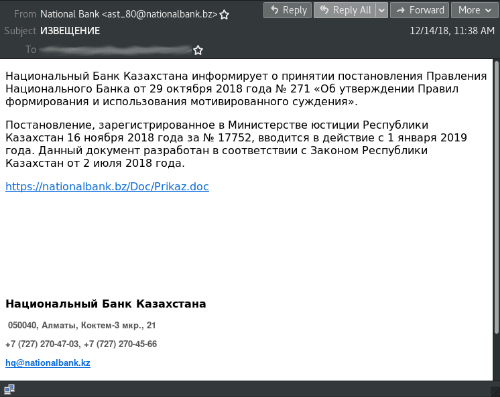
An email purporting to be from the National Bank of Kazakhstan
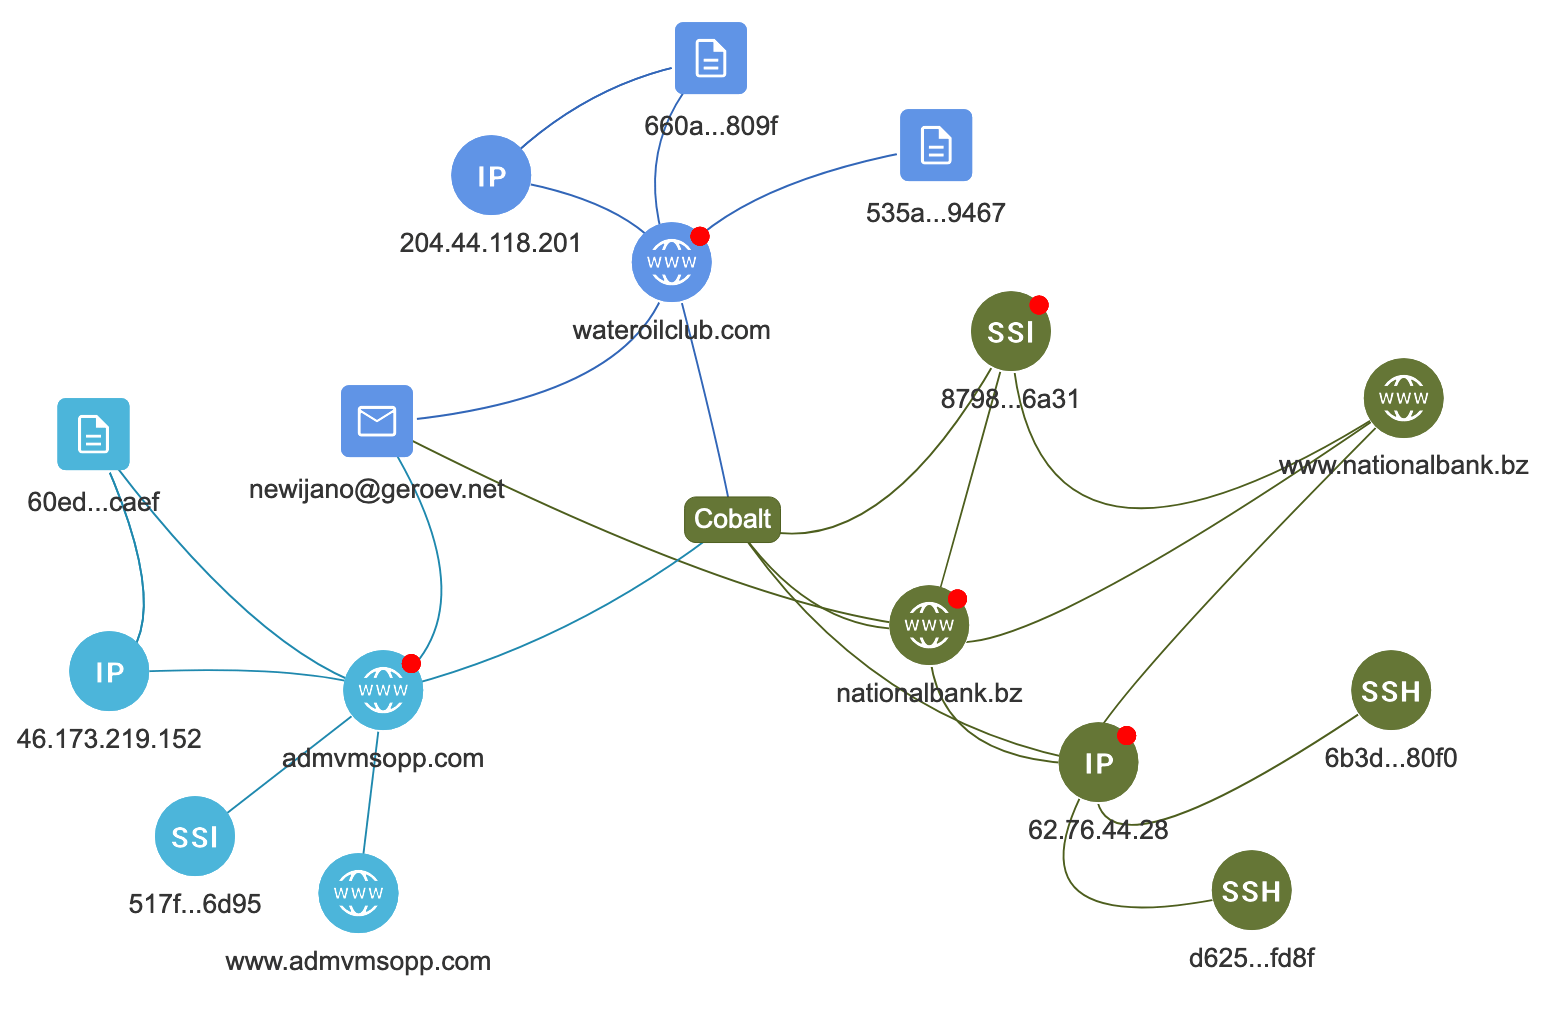
The emails contained links to hXXps://nationalbank[.]bz/Doc/Prikaz.doc. The document contained a macros that launched powershell, which, in turn, tried to download and execute a file from hXXp://wateroilclub[.]com/file/dwm.exe in %Temp%\einmrmdmy.exe. The file %Temp%\einmrmdmy.exe aka dwm.exe is a CobInt stager, configured to work with the server hXXp://admvmsopp[.]com/rilruietguadvtoefmuy.
Imagine that there is no opportunity to obtain these phishing emails and thoroughly analyse the malicious files. The graph created based on the malicious domain “nationalbank[.]bz” immediately shows links to other malicious domains, attributes them to a specific group, and shows what files were used in the attack.
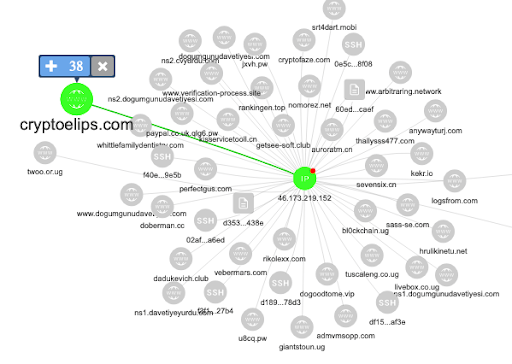
Let’s take one of the elements of this graph, IP address 46.173.219[.]152, and create another graph based on it, with one step and with refined option turned on. This will lead to finding at least 40 new domains, including:
- bl0ckchain[.]ug
- paypal.co.uk.qlg6[.]pw
- cryptoelips[.]com.
Judging from the domain names, it seems that they are used in fraudulent schemes. The refine mechanism has determined, however, that they do not have any relation to this attack and they were therefore not included in the graph, which facilitated the analysis and attribution process.
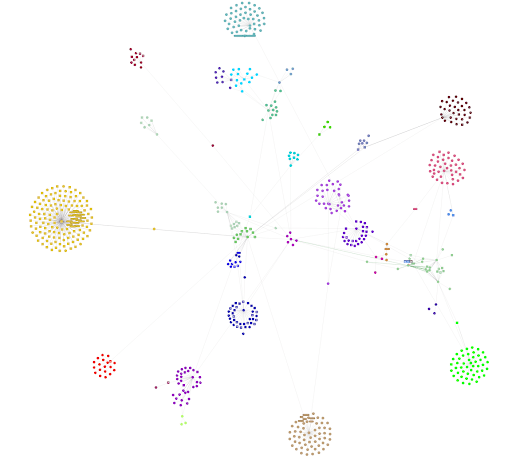
If we create another graph using the domain “nationalbank[.]bz” but with the refine option turned off, there will be more than 500 elements on the graph, with most of them having no relation to either the cybercriminal group Cobalt or to the attacks. The picture below depicts such a graph:
Conclusion
After many years of delicate refining, tests in real incident response operations, and threat hunting, we have successfully not only developed a unique tool but also changed experts’ attitude towards it within our company. At first, technical researchers tried to insist on total control over the graph creation process. It was extremely difficult to persuade them that creating a graph in automated mode can be more accurate than in manual one. Nevertheless, time and numerous manual checks of the graph analysis outcomes have done their magic. Our experts now not only trust the system but also use the analysis results in their daily work. Graph technology is used in all our solutions and helps improve the threat detection process. The interface for manual graph analysis has been integrated into our services and has considerably expanded threat and cybercrime hunting opportunities. The analysts working for our clients have confirmed this. For our part, we will continue to enrich our graph with data and design new algorithms using artificial intelligence to improve the graph’s accuracy.


